ONE44 Soybeans and Fibonacci
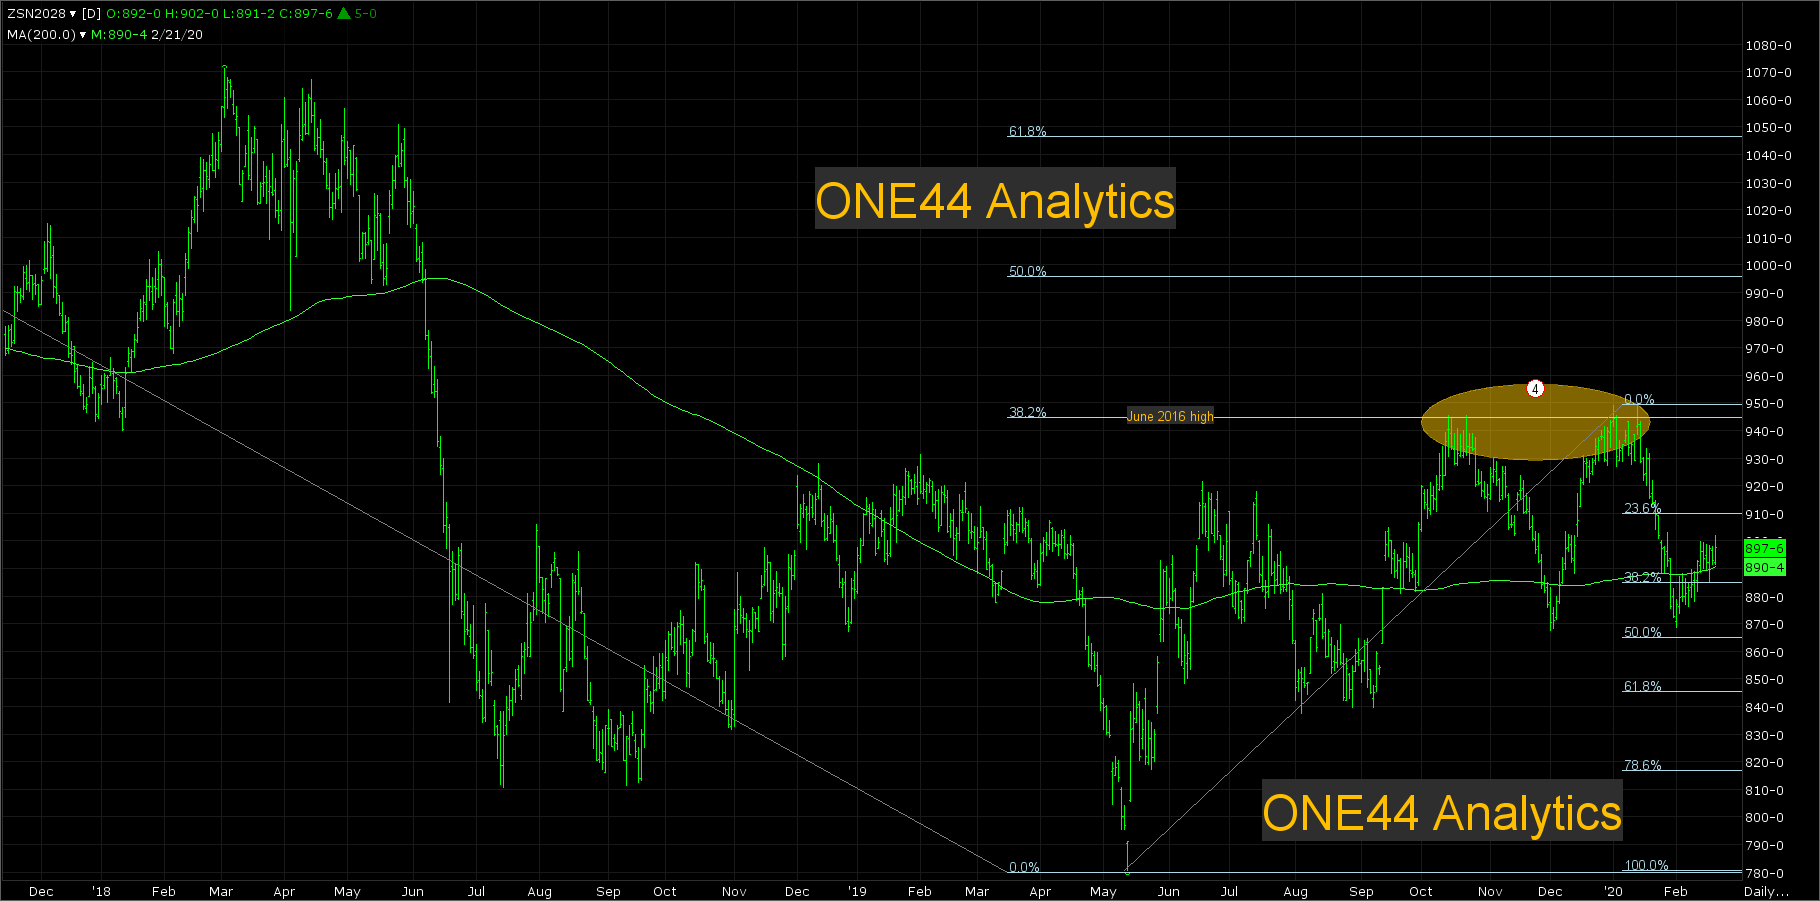
The Soybeans are currently above the 200 day average at 890.50 and above our long term swing point of 885.00 based on the nearby contract. When we look further back to see what Fibonacci retracements are at work, (chart attached) we can see that the 945.00 level was 38.2% back to the June 2016 high at 1208.50. They have reacted from this level twice, once in October 2019 and again in January of this year. In both cases the break took it below the 200 day average and 38.2% of the rally from the 780.50 low for a short time. Being back above 38.2% and the 200 day average puts it in a positive position and you now have to watch the retracements back up to the 949.00 high and 38.2% back up is 900.00, if this is all they can rally after getting back above the long term swing point, it is a negative sign.
The bigger picture
As long as they continue to close above the long term swing point of 885.00, our target is 1045.00. This target comes from the 38.2% rule, that any market that holds 38.2% and does not go on to make a new high/low is the first sign of a change in the current direction and you should look for 61.8% of the same move.
Summary
As long the beans continue to close above 885.00, our long term target is 1045.00 and with a couple solid closes back below 885.00 the long term target becomes 820.00.