Ripple and the 61.8% rule
ONE44 Analytics where the analysis is concise and to the point
Our goal is to not only give you actionable information, but to help you understand why we think this is happening based on pure price analysis with Fibonacci retracements, that we believe are the underlying structure of all markets and Gann squares.
For the ONE44 Fibonacci rules and guidelines to help with this article, go here.
Charts are courtesy of Barchart.com
RIPPLE
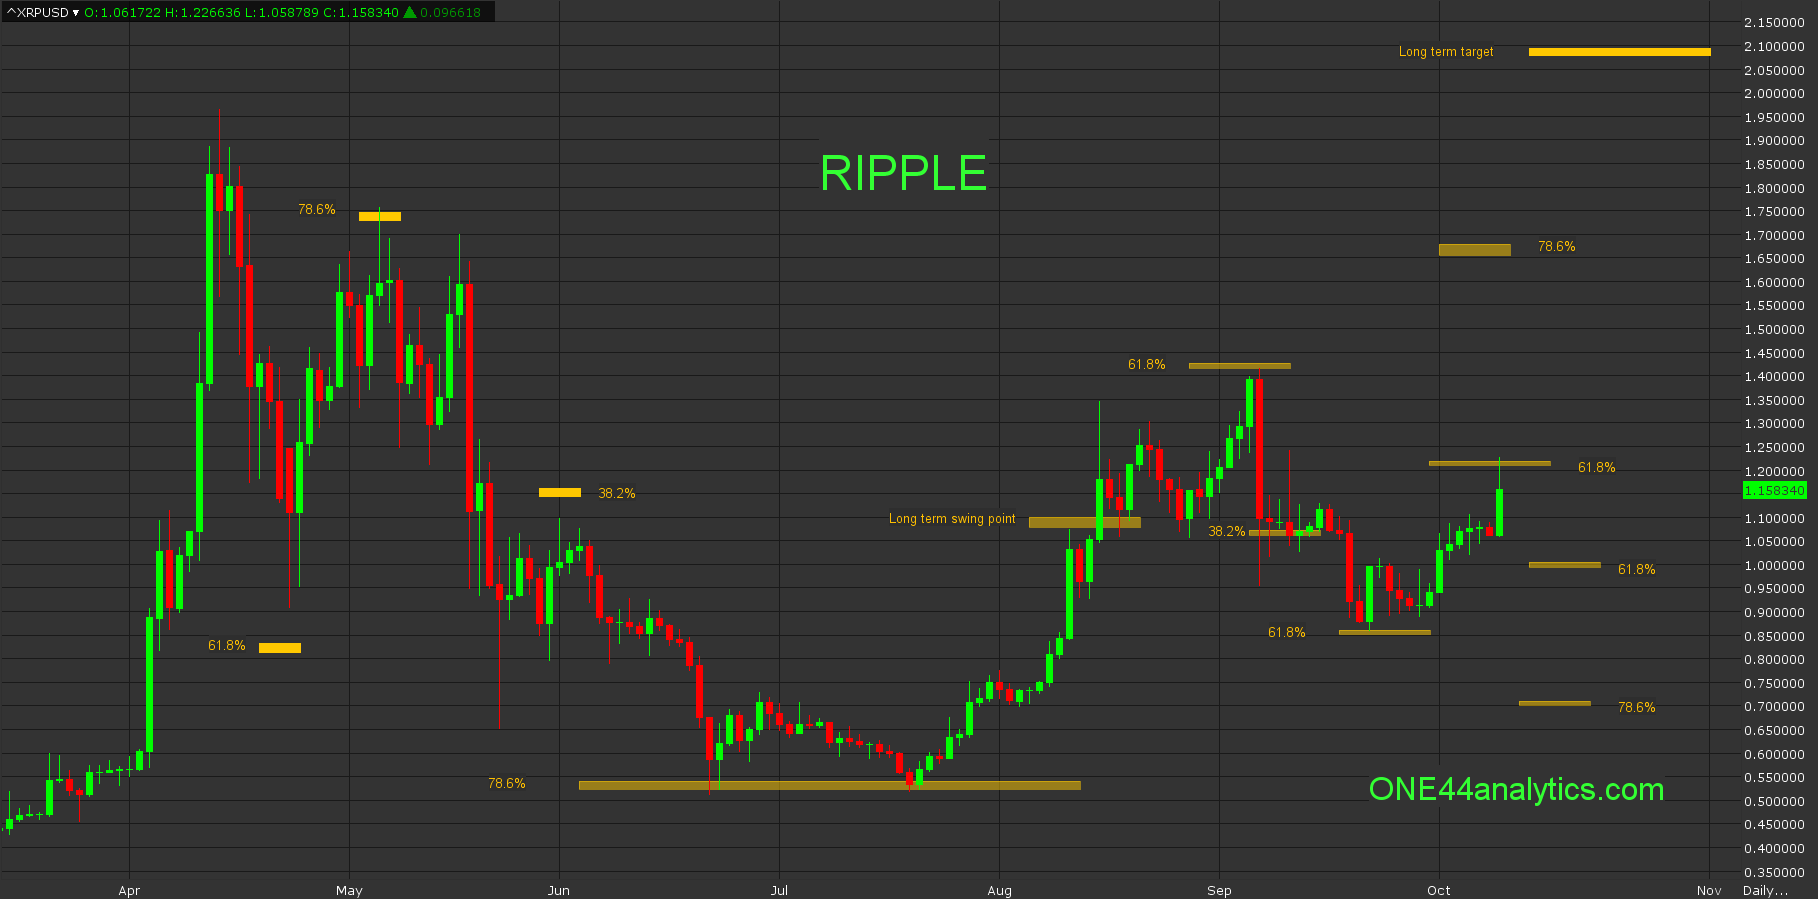
Looking at the 9/7/21 high on the chart below we can see that it was 61.8% of the 4/14/21 high and 6/22/21 low. Following the ONE44 61.8% rule, any market that holds 61.8%, should go 61.8% of where it just came from. This usually happens when a market is directionless, or in a consolidation period. Knowing this the target on a break from that high was 0.86 (61.8%) and this was achieved on 9/22/21. Using the same 61.8% rule, the target on a rally from that low, is 1.21 and this was hit this morning. Our target now on a setback is 61.8% at 1.00.
Going back to the high on 5/6/21 we can use the 78.6% rule that is, Any market that hits 78.6% should go 78.6% back the other way. This is also where a lot of Bull markets end and start.
Looking at that high on the chart we can see that it was 78.6% of the move from 4/14/21 to 4/23/21 and this is where the Bull run ended. The break from that high took it all the way back to 78.6% of the 4/14/21 high and the 2020 low. This was hit on 6/22/21 and then again on 7/20/21. The long term target from here is 78.6% of that low and the 4/14/21 high, this is 1.65.
For now, look for the consolidation to continue between the 61.8% levels, once they break out of that range you can look for 1.65 (78.6%) on the upside and then our long term target of 2.09. On the downside look for 0.71 (78.6%).
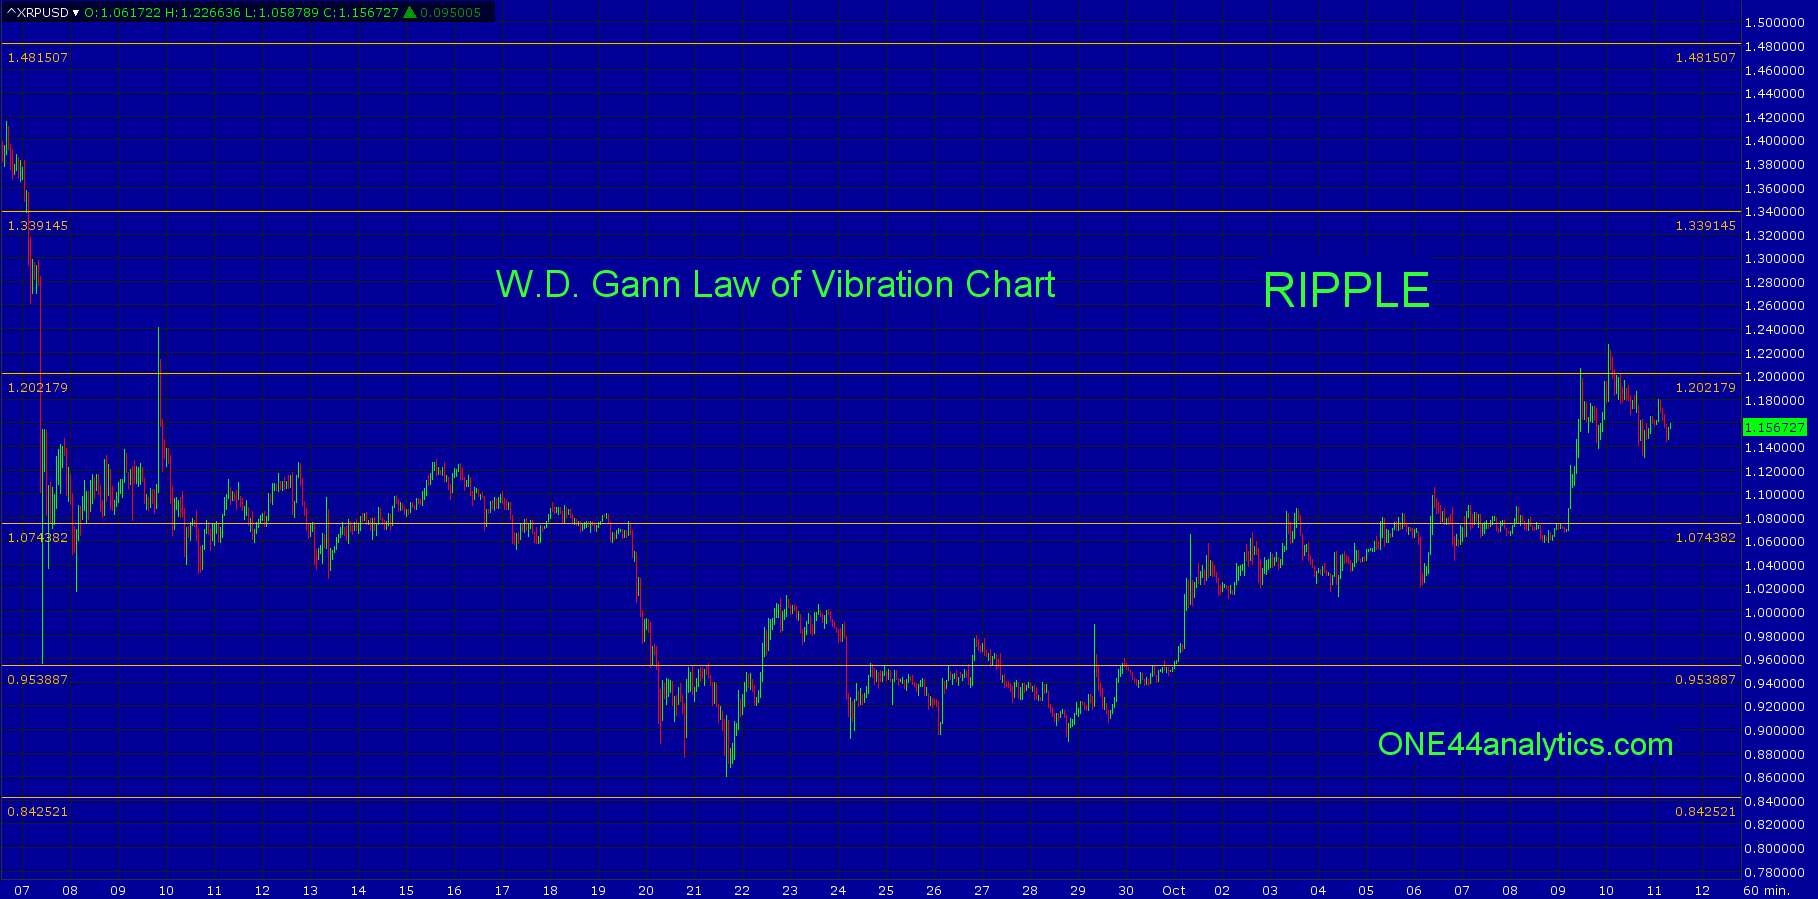
The second chart below is a support and resistance chart based on Gann's Law of Vibration.
You can get the Cryptocurrency charts for free here, they are updated daily.
Sign up for our Free newsletter here.
FULL RISK DISCLOSURE: Futures trading contains substantial risk and is not for every investor. An investor could potentially lose all or more than the initial investment. Commission Rule 4.41(b)(1)(I) hypothetical or simulated performance results have certain inherent limitations. Unlike an actual performance record, simulated results do not represent actual trading. Also, since the trades have not actually been executed, the results may have under- or over-compensated for the impact, if any, of certain market factors, such as lack of liquidity. Simulated trading programs in general are also subject to the fact that they are designed with the benefit of hindsight. No representation is being made that any account will or is likely to achieve profits or losses similar to those shown. Past performance is not necessarily indicative of future results.