RIPPLE BOTTOM .35?

ONE44 Analytics where the analysis is concise and to the point
Our goal is to not only give you actionable information, but to help you understand why we think this is happening based on pure price analysis with Fibonacci retracements, that we believe are the underlying structure of all markets and Gann squares.
Ripple
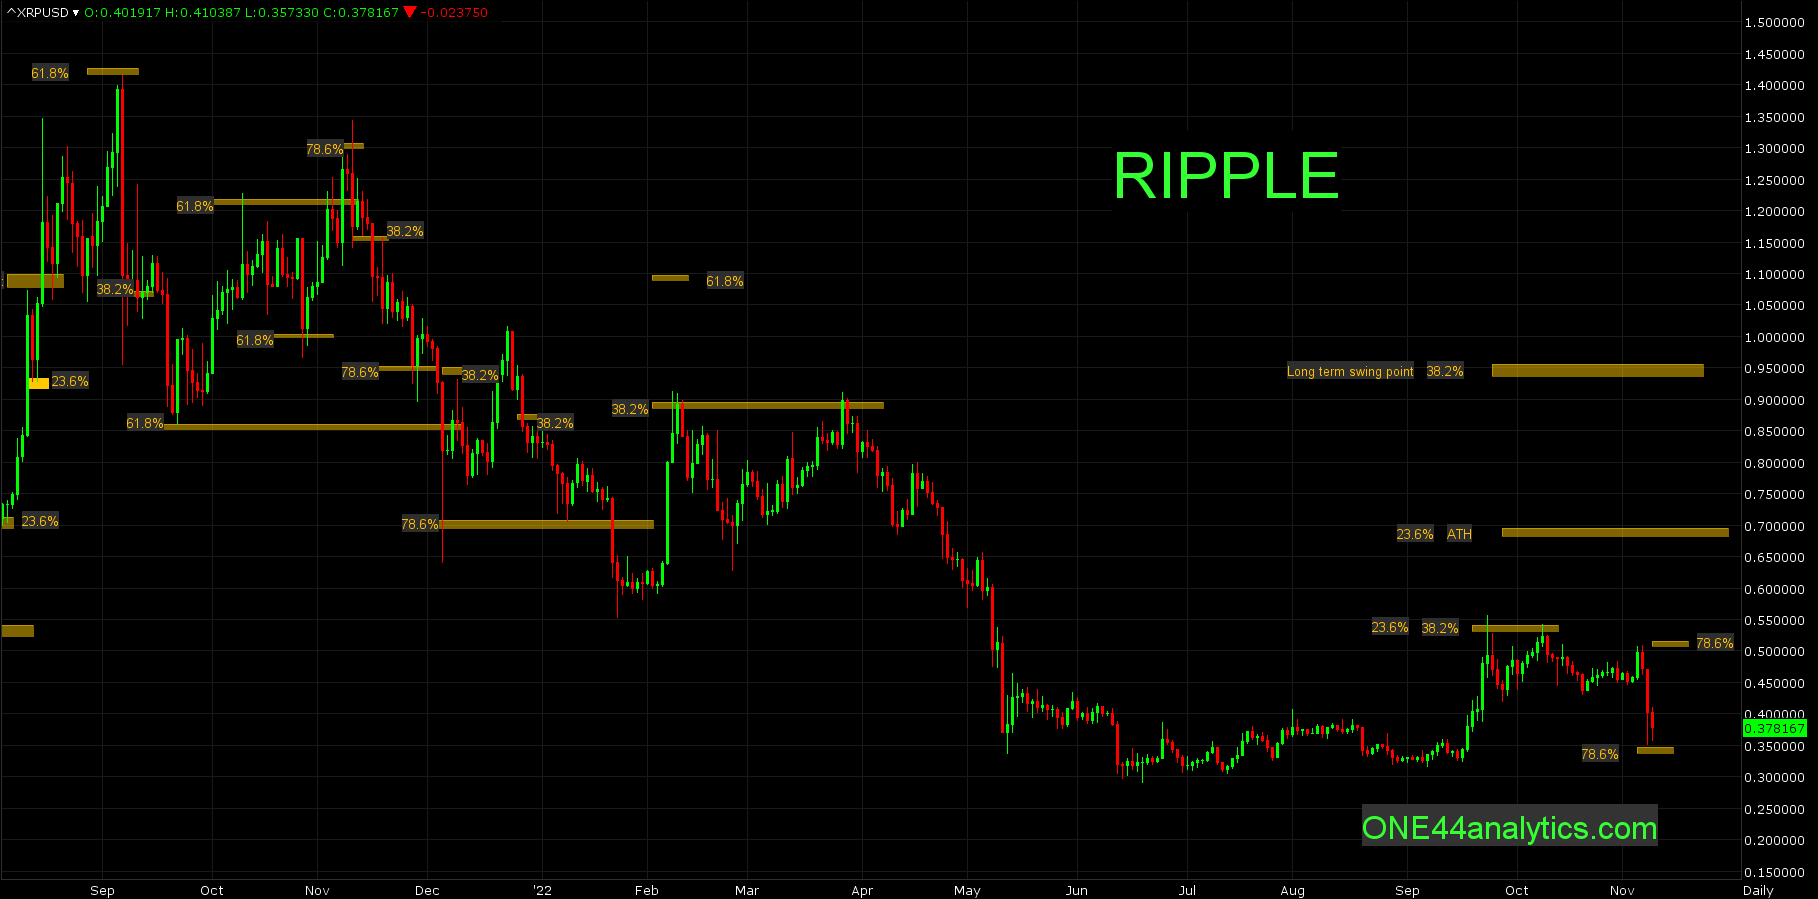
When we use just the Fibonacci retracements with the ONE44 rules and guidelines you can see on the chart how every attempt to rally has been stopped by key retracements. Starting with the high back on 9/7/21 it hit 61.8% back to the ATH.
Following the ONE44 61.8% rule, we should have been looking for 61.8% the other way and this was completed on 9/22/21. It then went on to hit 61.8% two more times on 10/11/21 and 10/27/21.
The high on 11/10/22 hit 78.6% and following the ONE44 78.6% rule we were looking for 78.6% the other way and this happened on 11/29/22, the second part of this rule is, it can be the end, or start of a Bull run. In this case it ended the run higher and sent it into a tailspin.
The highs on 2/8/22 and 3/28/22 hit 38.2% back to the 9/7/21 high and new lows follow as you would expect from this retracement.
The next attempt to rally on 9/23/22 hit a combination of 23.6% back to the 9/7/21 high and the 2/8/22 high at .54 and this brings us to where we are now.
NOW
Using the 9/23/22 high and 6/20/22 low, 78.6% of that range is .35. Using the ONE44 78.6% rule again, we will look for 78.6% the other way to start, this is .51 and longer term holding .35 can be the start of another Bull run. Provided this area holds, the short term target will be 23.6% back to the ATH at .68 and longer term it will be the long term swing point that is 38.2% back to the ATH at .93. With a failure to turn higher from .35 look for another 6 months of sideways movement.
FULL RISK DISCLOSURE: Futures trading contains substantial risk and is not for every investor. An investor could potentially lose all or more than the initial investment. Commission Rule 4.41(b)(1)(I) hypothetical or simulated performance results have certain inherent limitations. Unlike an actual performance record, simulated results do not represent actual trading. Also, since the trades have not actually been executed, the results may have under- or over-compensated for the impact, if any, of certain market factors, such as lack of liquidity. Simulated trading programs in general are also subject to the fact that they are designed with the benefit of hindsight. No representation is being made that any account will or is likely to achieve profits or losses similar to those shown. Past performance is not necessarily indicative of future results.