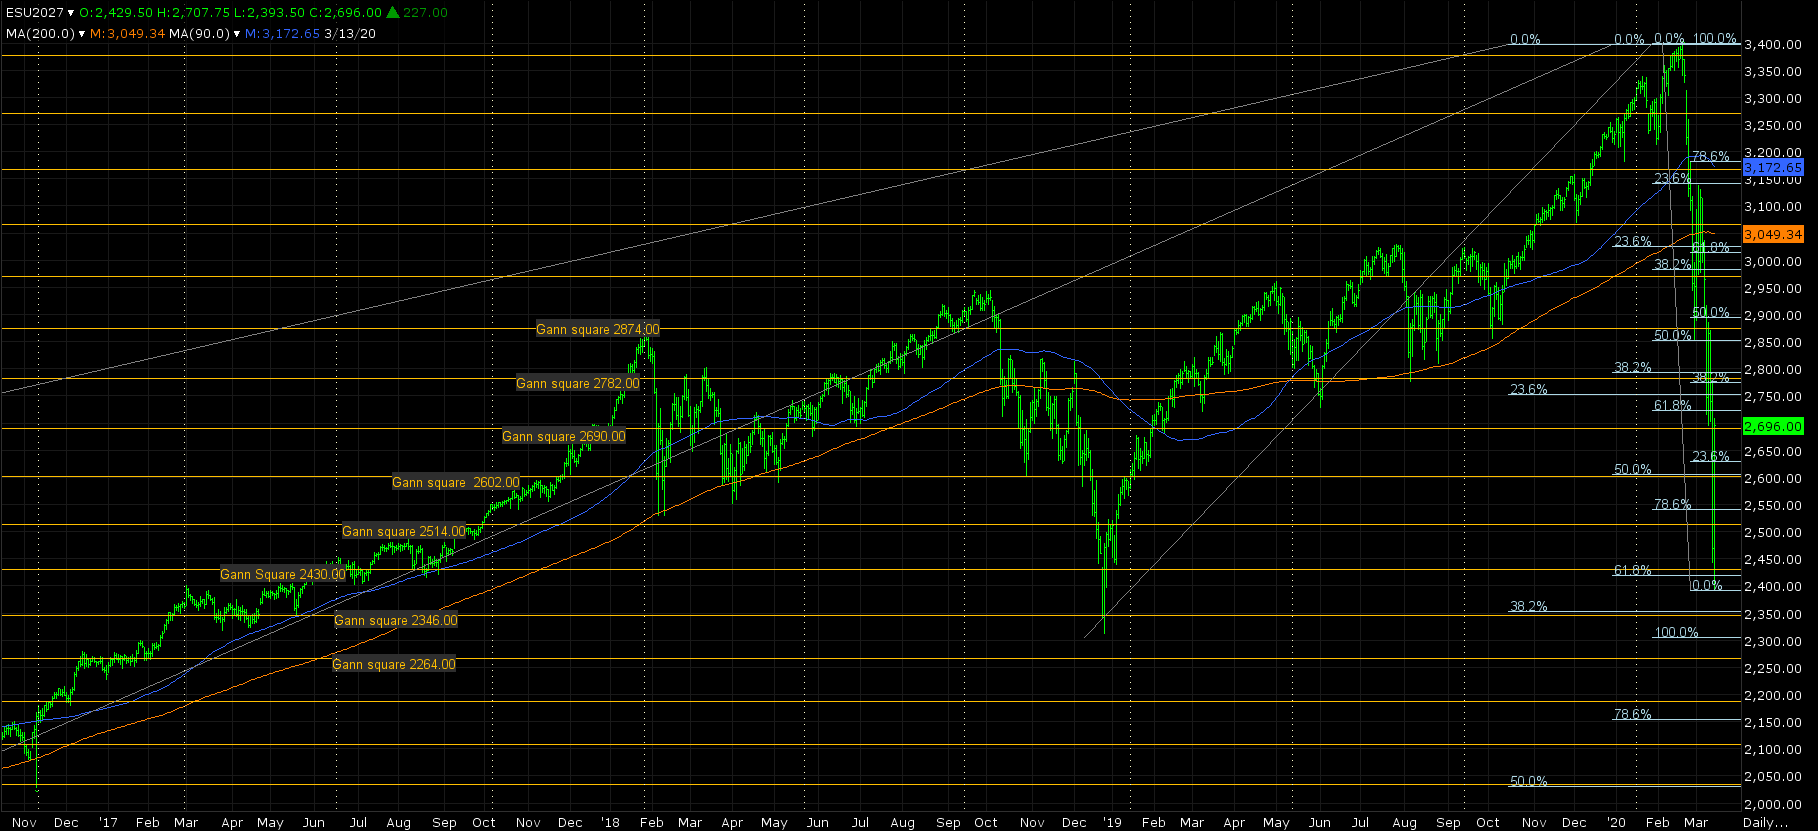
S&P 500 major levels
These are the targets for the upside if that's the low and if it's not.
ESM20
The S&P low on Friday didn't get down to 38.2% of the all-time high and the 2009 low, this was 2354.00. It did however hit 61.8% back to the 2016 low, this was 2420.00. IF, this is going to be a longer term low it will have to be proven by taking out key levels above. Friday's close took the first one out at 2631.00, this was 23.6% back to the all-time high, you can now use this as the long term swing point. Provided they are right back below it Sunday night, look for 2354.00. The next level to see if the break is over for now is 38.2% back to the all-time high. this is 2778.00, you also have a major Gann square at 2782.00. It is this level that would have to come out in order to say that the bottom is in. Once they trade above this level it would then become the long term swing point. Another way to tell if the low is in, is that it starts to hold 38.2% back on any breaks, this has not happened yet.
These are the targets for the upside if that's the low and if it's not.
First the upside, since they held well above 38.2% back to the 2009 low, the usual target for the 38.2% rule should still be in force and this would tell us new all-time highs or, at least a test of it, this could take a long time. With it hitting 61.8% back to the 2016 low, the target is 61.8% back the other way, this is 3015.00 and could happen next week. A failure to get above 38.2% of the move at 2778.00, or trading above it and closing back below it should send them back to the lows.
Now for the downside, you will still have to watch for 2354.00 on a new low, making a slightly lower low and closing back above the old low would be a good sign and closing below there would then make this the long term swing point. The next long term target will then be 1710.00.