S&P 500 Top?
ONE44 Analytics where the analysis is concise and to the point
S&P/ESH21
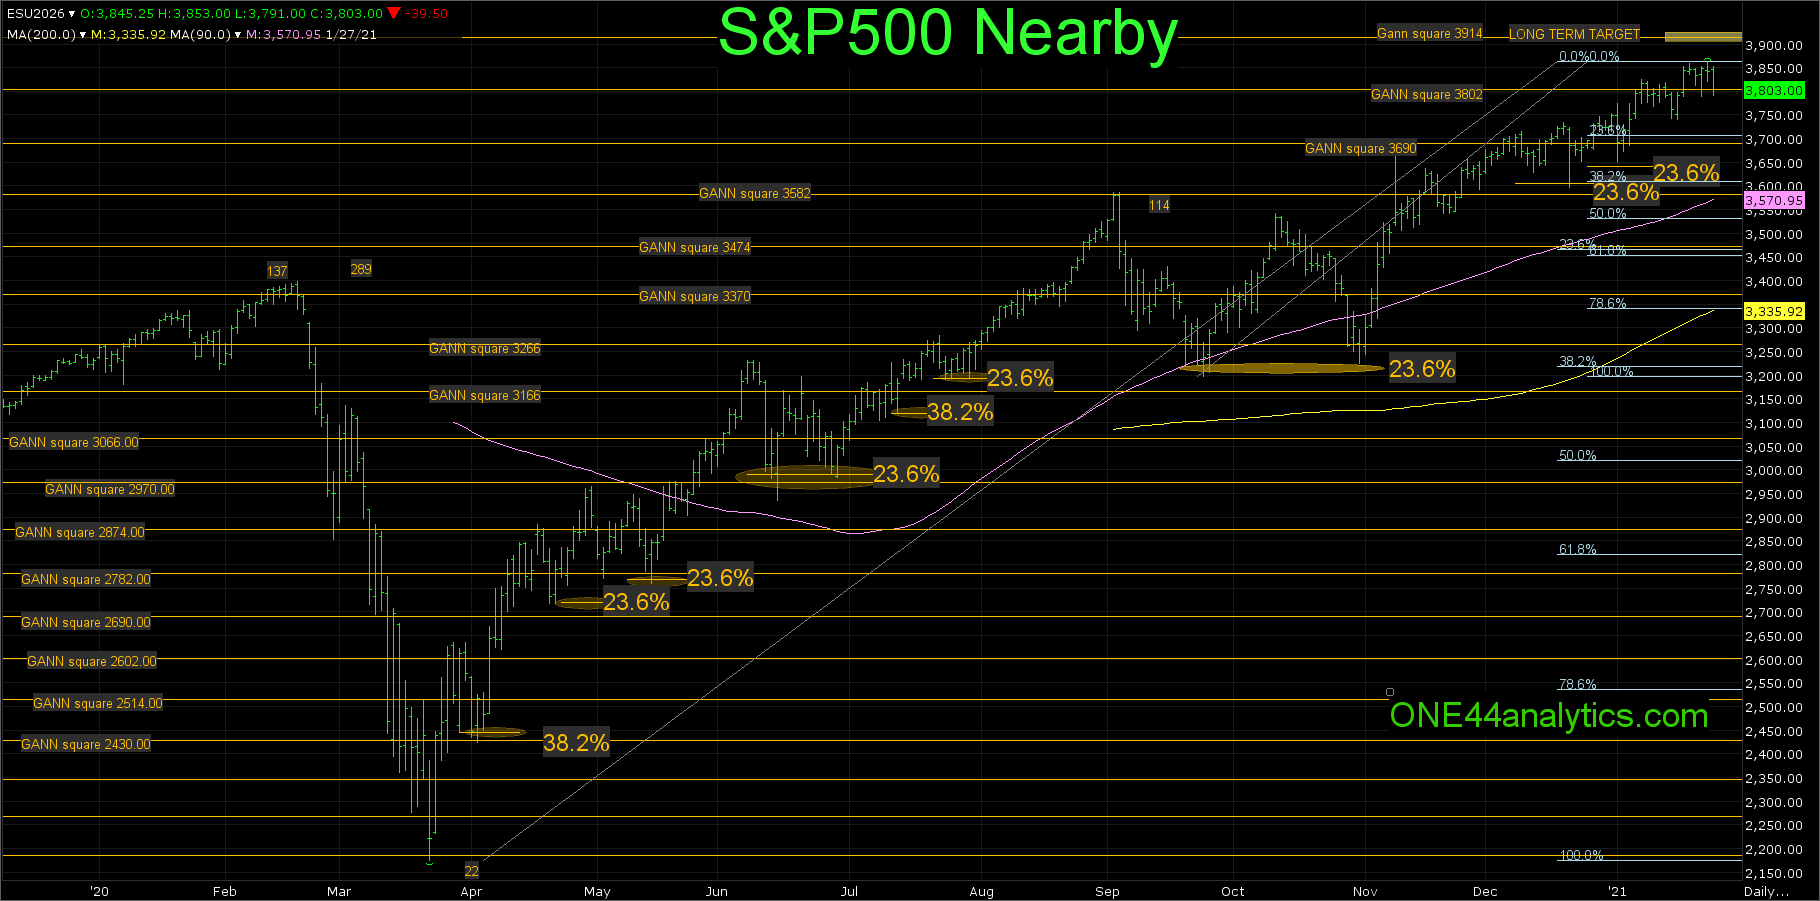
Since our post on 11/8/20 our long term target has been the cluster of major Gann squares up between 3914.00 and 3938.00.
As we approach this area be aware that it can cause a larger than normal setback.
11/8/20
ESZ20
The S&P has had two closes above the 3474.00 major Gann square and swing point. As long as it remains above it, look for the 3690.00 major Gann square. Longer term the target is the next cluster of Gann squares up between 3914.00 to 3938.00.
On the chart below we have marked all the lows that stand out and what there were based on the Fibonacci retracements. The first setback to start this massive rally held 38.2% in April 2020 and every setback after that held 23.6% of the rally, or 23.6% of the 9/24/20 low keeping this market extremely positive. We know based on the ONE44 Analytics rules/guidelines that 38.2% must hold to keep the trend intact and that holding 23.6% keeps the market extremely strong. So, on any setback from the 3914.00 area these are the levels we will watch for to measure the strength, or weakness of the market. Watch the retracements back to the 3/23/20 low for the major trend and 9/24/20 for the shorter term trend.
What to look for if a longer term top is coming from the major Gann squares.
Ideally we would like to see it hit the cluster of major Gann squares up at 3914.00, however a solid close back below the 3802.00 major Gann square can cause the same effect. With the current top the tightest support is 3705.00, this is 23.6% back to the 9/24/20 low and a major Gann square at 3690.00, so this will be the first target area. Provided this is all they can get down to the market remains very positive. On a bigger setback look for 3606.00, this is 38.2% of the same move. With a hard break from the top look for the area of 3474.00 to 3450.00, between these levels is a major Gann square, 61.8% back to the 9/24/20 low and the most important is 23.6% back to the 3/23/20 low at 3464.00. This will be the first long term target.
A couple things to remember when using the Fibonacci retracements are, no matter what the targets are we will always watch all the retracements on any move to see just how weak, or strong the market is, also when and if this market turns lower it will start to hold the retracements above, just as it has the whole way up.
Sign up for our Free newsletter HERE
These are our latest videos on how to use the Fibonacci retracements. Even if you do not trade the market covered the rules and guidelines are the same, as we believe the Fibonacci retracements are the underlying structure of all markets.
https://www.youtube.com/watch?v=VevYJrt-R6I&t=16s&ab_channel=ONE44Analytics
https://www.youtube.com/watch?v=qKYKtSjm3PQ&ab_channel=ONE44Analytics