S&P bottom
When you look at the daily chart, it looks like it made a new low below the 2910.00 1x1 and then closed back above the 2970.00 major Gann square, great bottoms in, but this totally belies the days action. From 8:30 to the close it had a years worth of major swings, but at the end of the day, it did the things needed to say a low should be in for the time being. With today's close they also took out 23.6% of the move down at 2981.00. The level to watch below to say the rally is going to continue is 38.2% at 2940.00, below here they can go for the lows again. If any break can only get to 2960.00 this would be a very strong sign and the next target above it is 38% of the move down at 3056.00, they need to close above here to confirm the low is in and to look for a run at the highs again. In the S&P they pushed hard through 38% (2984.00) of the Dec. 2018 low, but closed back above it today.
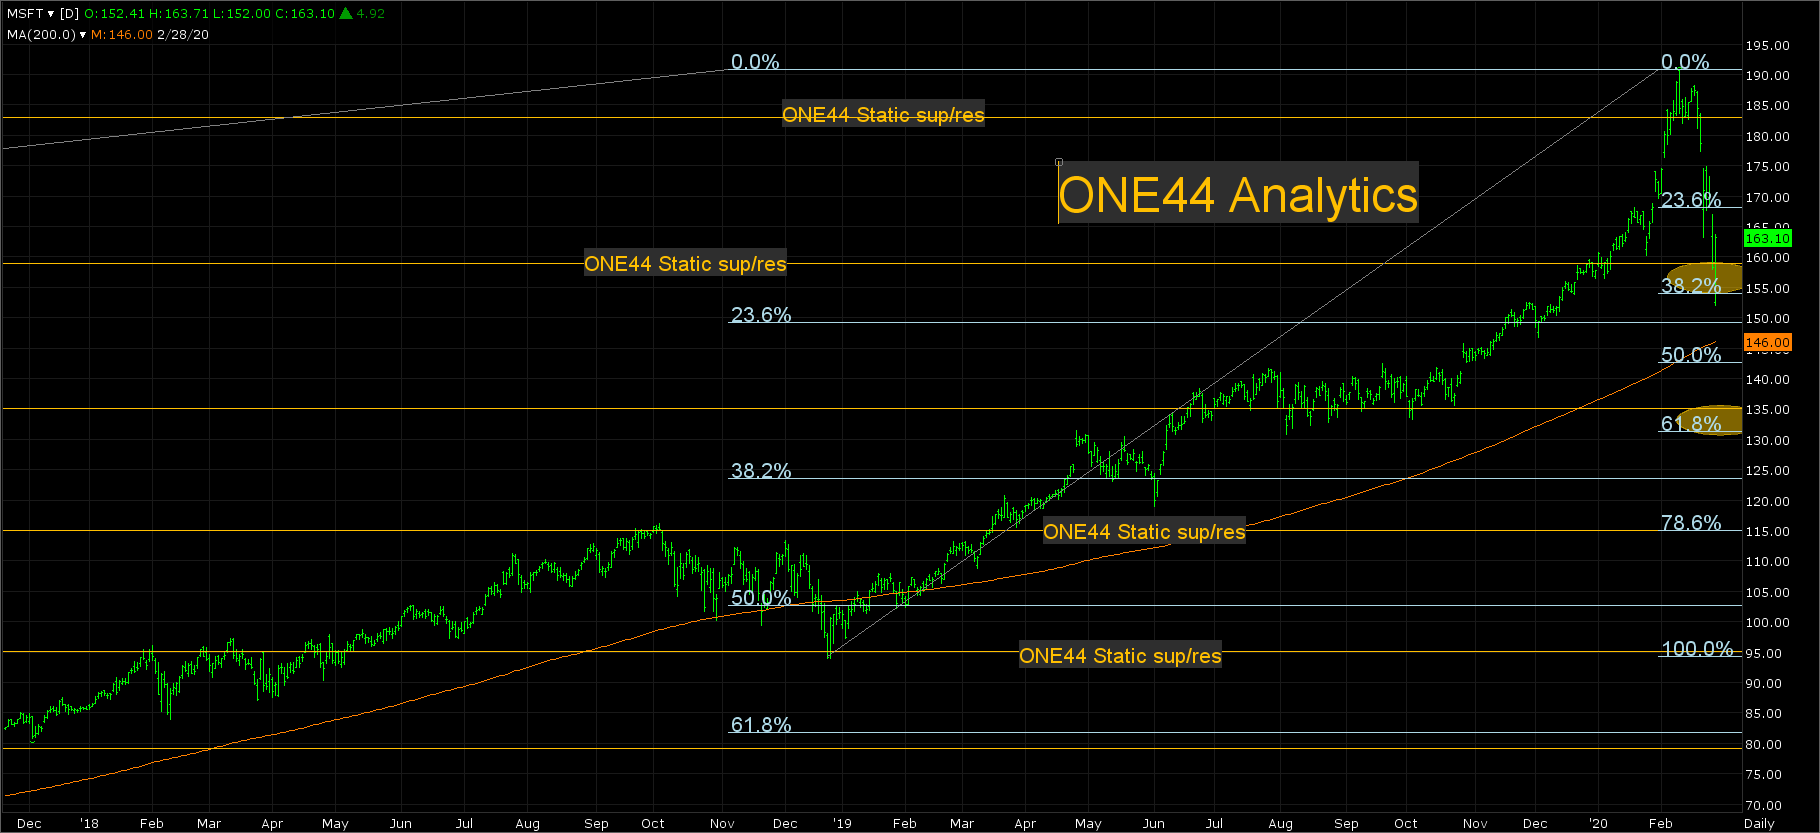
What was much better was the way MSFT and the FANGs minus NFLX reacted to their major retracements and major Gann squares.
MSFT hit the first target of 154.00 and rallied $10.
AMZN traded below the target area of 1870.00 to 1850.00, these were big retracements, a major Gann square and the 200 day average and then closed well above it.
FB hit the target of 186.00 and ended up $7 higher from there.
AAPL hit the 257.00 target that was a major Gann square and 38.2% of the Dec. 2018 low.
GOOGL hit the 1283.00 target that was a major Gann square and 23.6% back to the 2015 low.
All of these levels have to continue to hold and as long as they do they all should be going back to test their all-time highs.