S&P TOP ???
ESH21
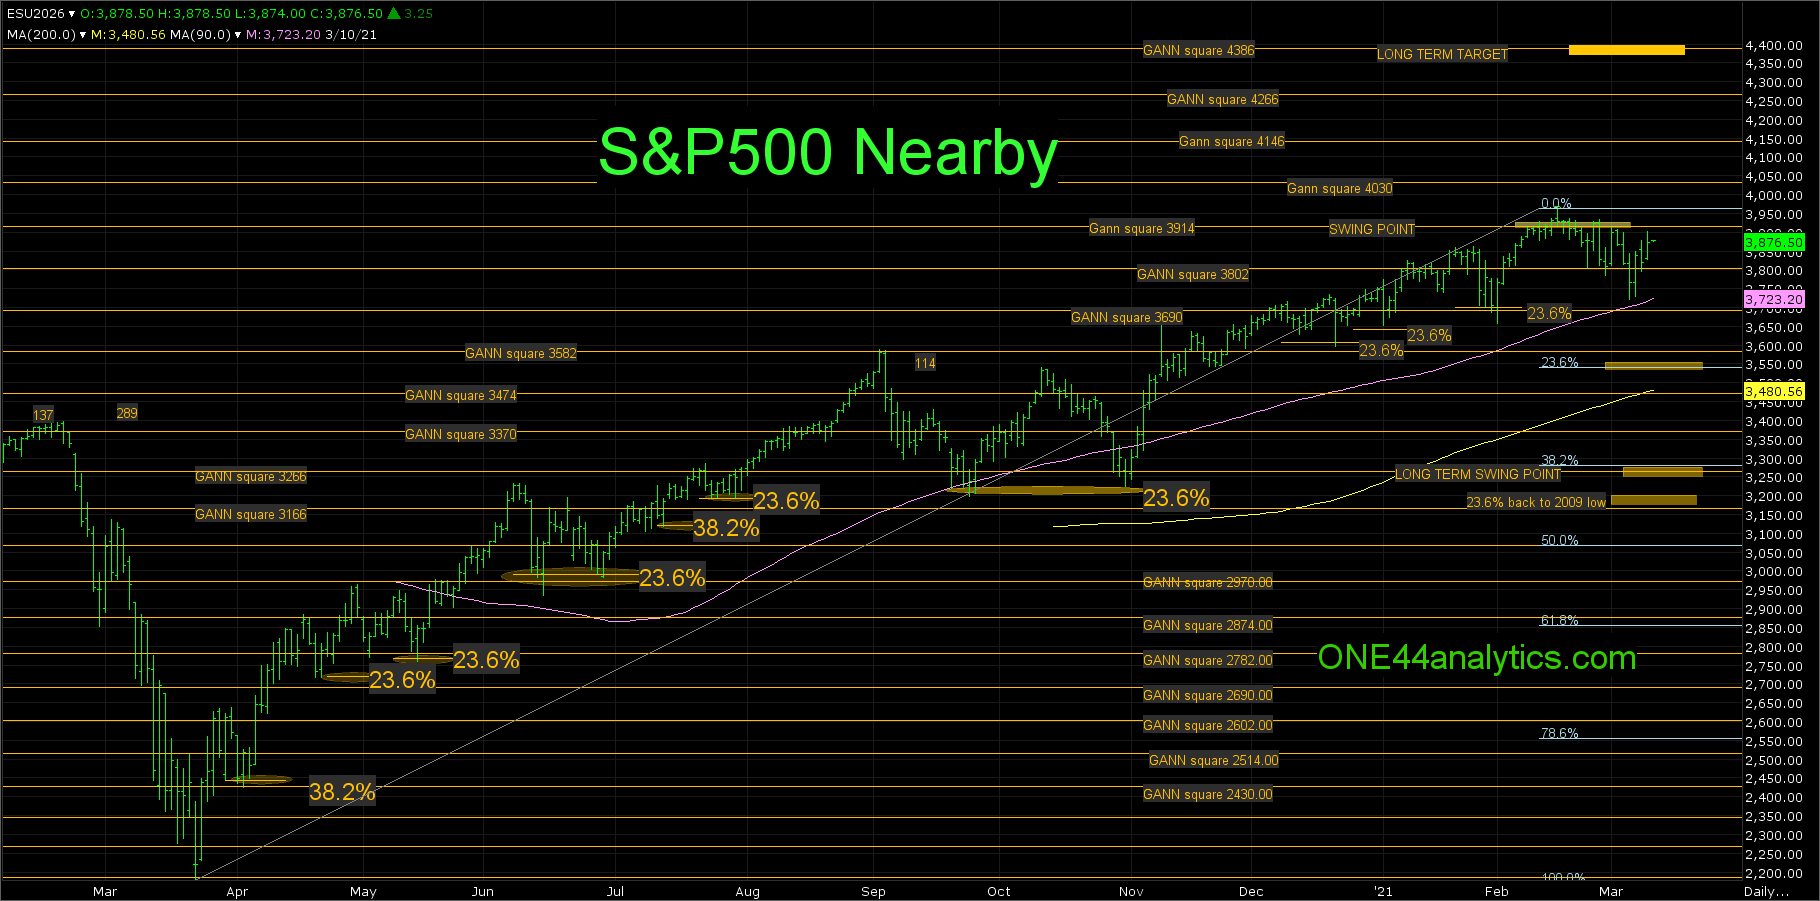
First off I want to say, they continue to make higher highs and higher lows in the major trend and the recent break down to 3720.50 could not stay below 38.2% of it to say the trend is turning and with a solid close above the 3914.00 major Gann square, the next long term target will be the cluster of major Gann squares up at 4386.00. However I do want you to know the potential for a downside move if they fail up at the 3914.00 major Gann square and 78.6% (3910.00) back to the all-time high.
We should know very shortly which of the two ways it is going. With a solid close above 3914.00 you can forget about a top being in, as long as they remain above it, right back below brings the top back in play. As for the otherside, a lot of major moves have started in March, or retested recent highs, or lows, this is a big Gann seasonal thing, so the possibility is greater for a major move. I am also seeing more stocks violating key support areas. I think a break on a failure to make a new high could take it all the way down to the long term swing point of 3280.00, this is 38.2% back to the 3/23/20 low, or even 3185.00, this is 23.6% back to the 2009 low. For now, I would still like it to hit 3914.00 again, however if they fail to get there and take out 3833.00, this is 38.2% back to the 3720.50 low, a longer term break could be starting.
There are a lot of other levels to look for support if any break does start and I will send those as soon as we see it happening, for now I just wanted you to know the potential of a down move.