Signs of the NASDAQ 100 turning over
ONE44 Analytics where the analysis is concise and to the point
Our goal is to not only give you actionable information, but to help you understand why we think this is happening based on pure price analysis with Fibonacci retracements, that we believe are the underlying structure of all markets and Gann squares.
For the ONE44 Fibonacci rules and guidelines to help with this article, go here.
Charts are courtesy of Barchart.com
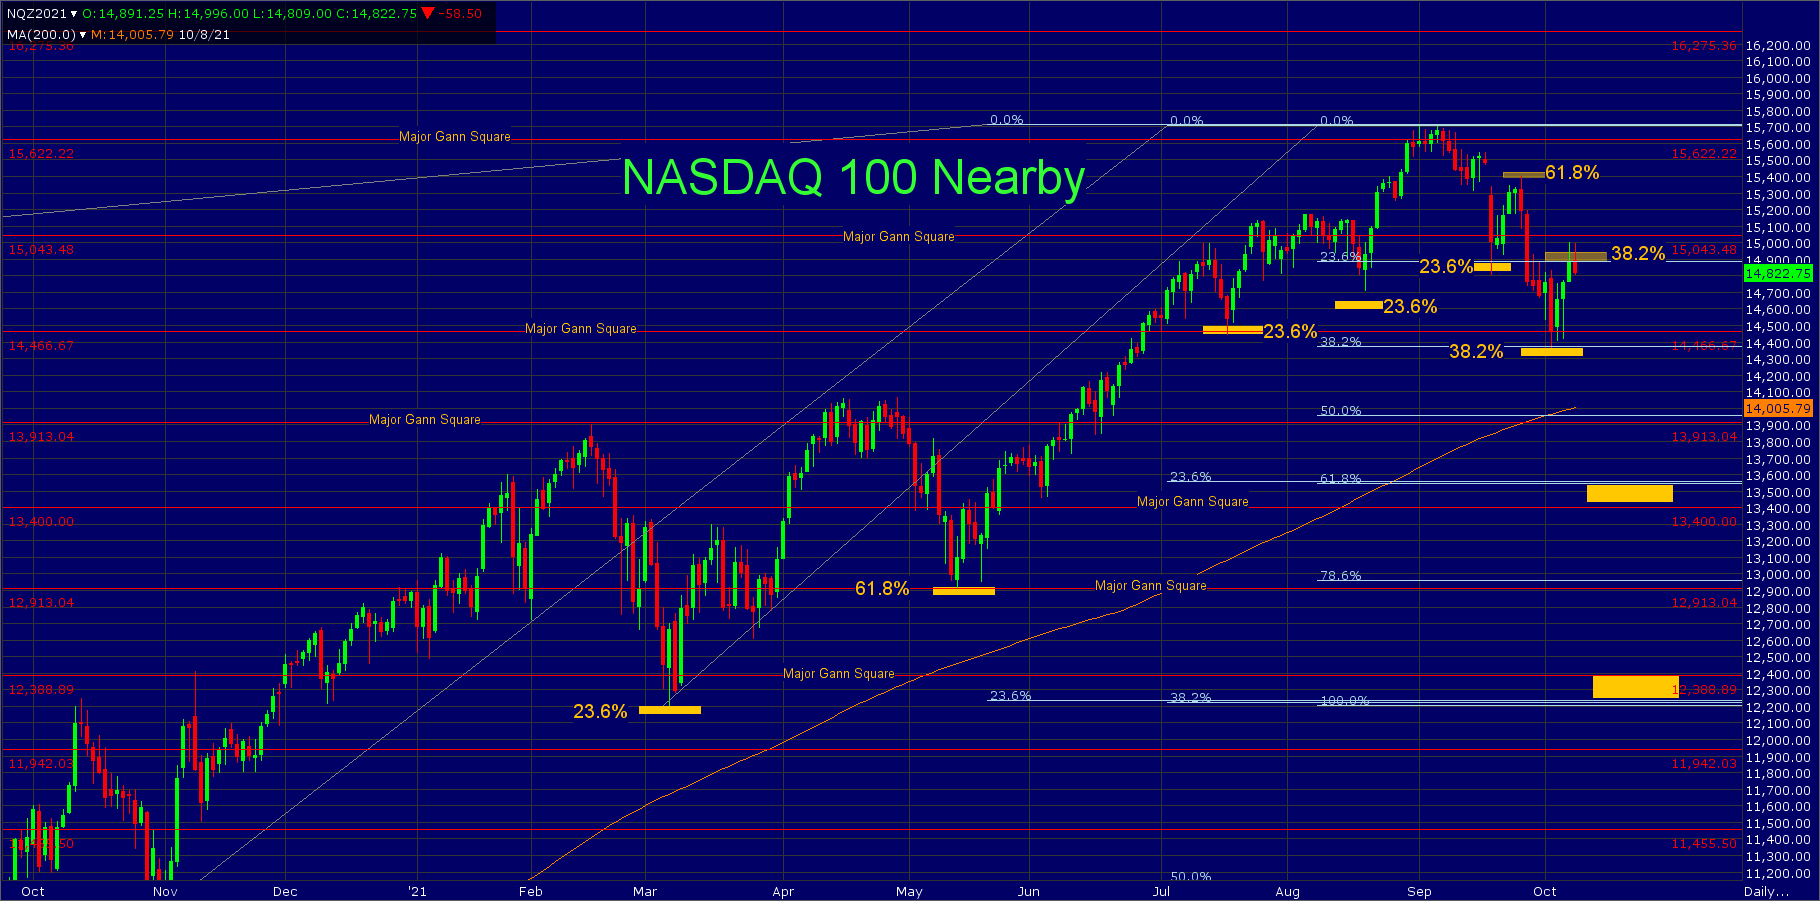
NASDAQ 100
The incredible run up looks to be coming to an end. The most obvious and simplistic reason is, since the 9/7/21 high it has been making lower lows and lower highs. What is more interesting is what those highs and lows are when following the ONE44 Fibonacci rules and guidelines.
We will start with the 3/5/21 low, this was 23.6% back to the 2020 low and following the 23.6% rule we know holding this keeps the trend extremely positive and it should go for new highs for the move. This did happen and the setback from there could not even get close to 23.6% of the 2020 low, however using the 3/5/21 low to retrace to, it held 61.8% of that low and the 12,193 major Gann square on 5/13/21. The target when holding 61.8% is to look for 61.8% in the opposite direction, it did this and more. The rally from it, sent it on a meteoric rally to new ATH's. The rally was so strong that we had to use the 5/13/21 low to get it to hit a retracement, this was on 7/19/21 and it held 23.6% of that low and the 14,466 major Gann square. The new highs from there could not even get back to 23.6% of that same low on 8/19/21.
The ATH of 15,708, was just above the 15,622 major Gann square, it traded there for nine trading days before it broke. The setback from the ATH hit 23.6% back to the 3/5/21 low on 9/20/21 and this is where things start to change. By holding 23.6% we would be looking for new highs, however the rally from it was only able to get 61.8% back to the ATH. This is the first sign of a trend change. The break from there took it to a new low and right into 38.2% of the 3/5/21 low on 10/4/21, it also hit the 14,466 major Gann square, it traded below it, but closed on it. Having hit 38.2% we will be looking for new highs for the move, as is expected when using the 38.2% rule, just as it was when it hit 23.6%. As we always say, we watch all the retracement on all moves to see just how strong, or weak the market is regardless of the longer term target.
The current rally is up against 38.2% to the ATH, provided this is all they can do, look for new lows for the move. Another sign of a trend change is when a smaller retracement in total price movement holds when coming from a much bigger retracement as is the 10/4/21 low.
Currently
The short term trend is down for the reasons stated above and failing to get a solid close above 14,900 (38.2%) they should go for new lows for the move. The long term trend is still very positive, however until the short term trend turns positive it can go test some long term support levels. These are 13,500 to 13,400, this area is 23.6% back to the 2020 low, 61.8% back to the 3/5/21 low and a major Gann square. Our longer term target on an extended break is the area of 12,390 to 12,250, this a major Gann square, 23.6% back to the 2009 low and 38.2% back to the 2020 low. With a close above the 15,050 major Gann square look for a retest of the 15,622 major Gann square.
Sign up for our Free newsletter here.
FULL RISK DISCLOSURE: Futures trading contains substantial risk and is not for every investor. An investor could potentially lose all or more than the initial investment. Commission Rule 4.41(b)(1)(I) hypothetical or simulated performance results have certain inherent limitations. Unlike an actual performance record, simulated results do not represent actual trading. Also, since the trades have not actually been executed, the results may have under- or over-compensated for the impact, if any, of certain market factors, such as lack of liquidity. Simulated trading programs in general are also subject to the fact that they are designed with the benefit of hindsight. No representation is being made that any account will or is likely to achieve profits or losses similar to those shown. Past performance is not necessarily indicative of future results.