Soybean and Corn major levels to watch
ONE44 Analytics where the analysis is concise and to the point
Our goal is to not only give you actionable information, but to help you understand why we think this is happening based on pure price analysis with Fibonacci retracements and Gann squares.
You can get all the rules and guidelines to the Fibonacci retracements on our website.
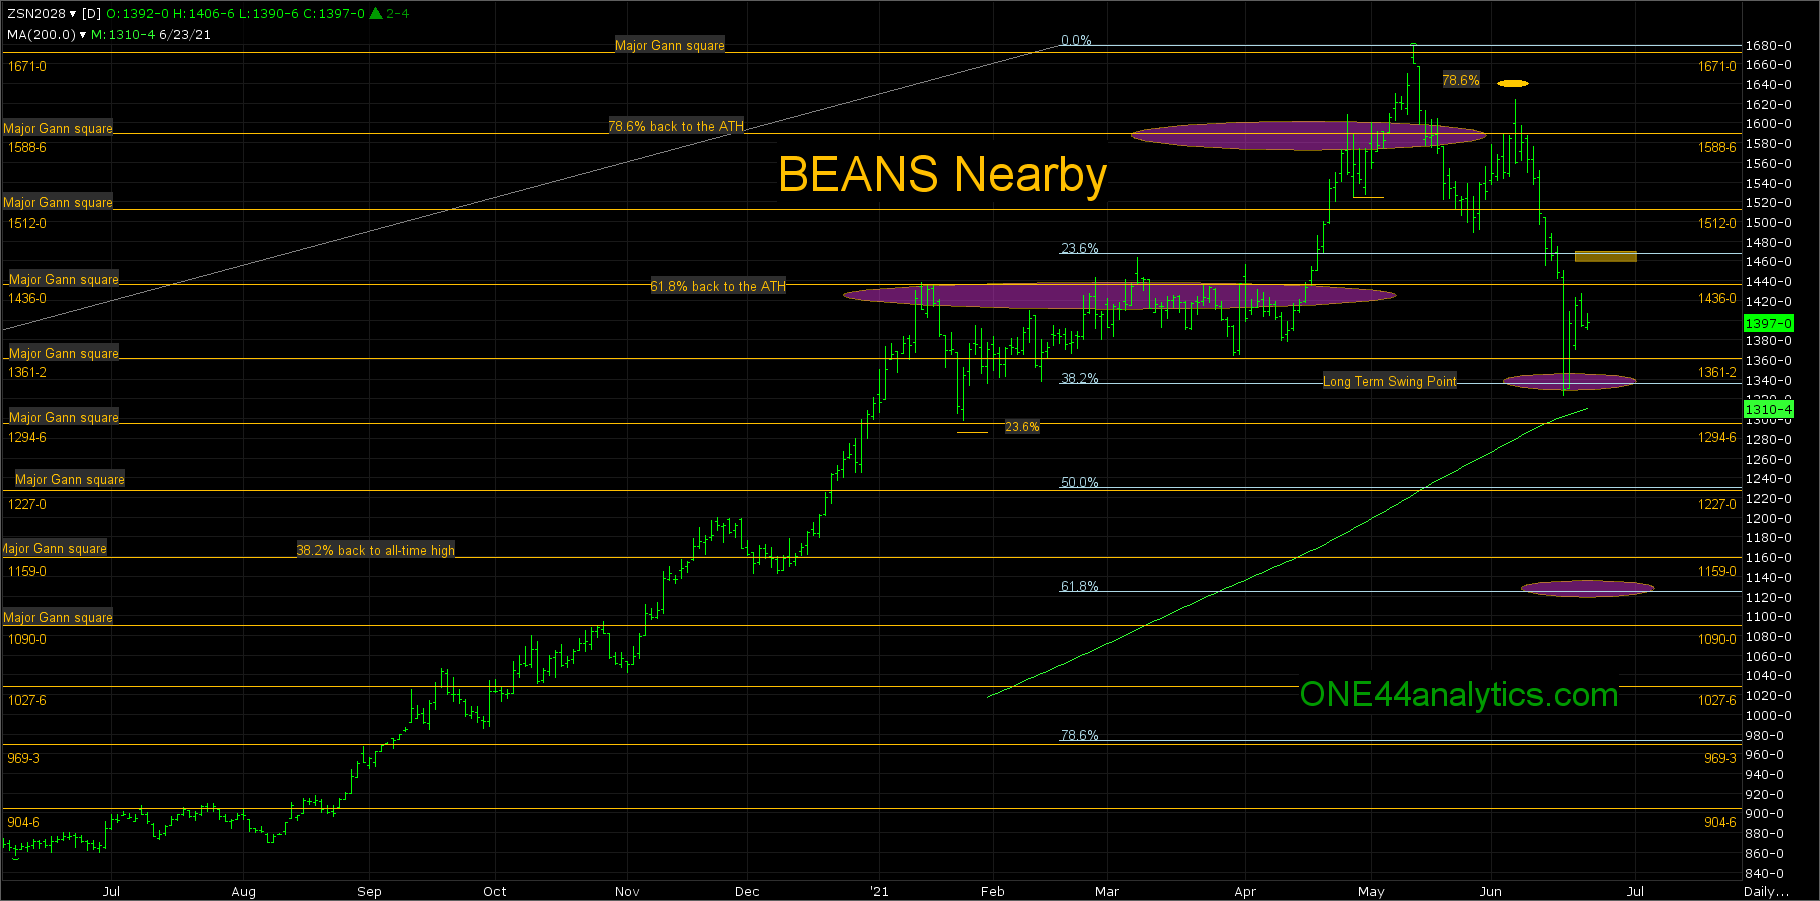
Soybeans
In our last update Soybean had just hit our long term swing point of 1335.00, our target based on the ONE44 rules and guidelines is new highs, however as always we watch all the retracements regardless of the target to see just how strong. or weak the market is.
In the July contract the key level above is 38.2% back to the high and this is 1460.00. Any rally that fails to get above here should send it to new lows. In the November contract that level is 1331.00, that was yesterday's high and you can use that as the short term swing point. Below it, look for 1230.00, this is 38.2% back to the 2020 low and the long term swing point.
A failure to hold the long term swing points should send them down to 61.8% of the whole move and this is 1125.00 in July and 1078.00 in November.
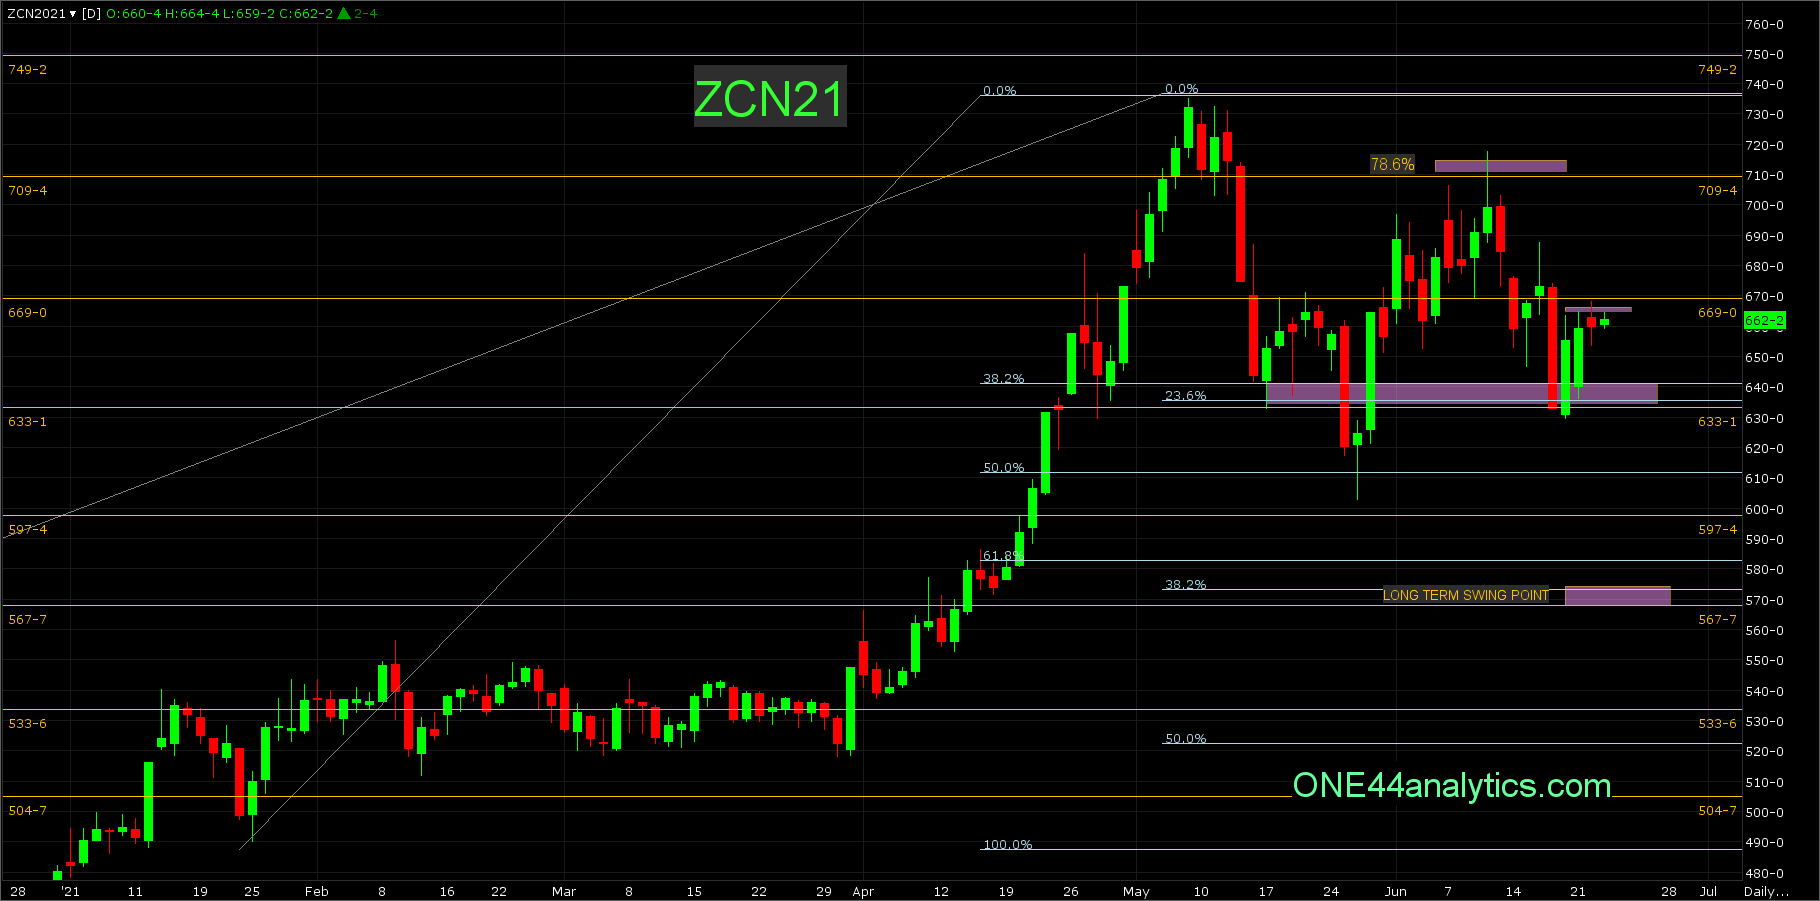
Corn
In our last update July Corn had just hit the 633.00 major Gann square and we posted...
"One thing to watch is, if they trade below the 633.00 major Gann square and then close back above 640.00, you can then look for a retest of the recent high. As always we will watch all the retracements on any move back up to see just how strong, or weak the market is."
This is exactly what they did last Friday and the key level above to watch is 664.00, this is 38.2% of the current break, use this as the short term swing point. Failing to get a solid close above this level should send it to the long term swing point of 572.00.
December Corn
Friday's low hit the long term swing point of 531.00, this is 38.2% back to the 2020 low. The rally so far has only been able to go 38.2% back up at 567.00 use this as the short term swing point. With a solid close below 531.00 the next target is 464.00, this is 61.8% of the move and the 200 day moving average. Provided they can get above the short term swing point, look for a retest of the recent high.
Sign up for our Free newsletter here.