Soybean update
ONE44 Analytics where the analysis is concise and to the point
Our goal is to not only give you actionable information, but to help you understand why we think this is happening based on pure price analysis with Fibonacci retracements and Gann squares.
You can get all the rules and guidelines to the Fibonacci retracements on our website
Soybeans
Long term the Beans are up against the 1436.00 major Gann square and 61.8% back to the all-time, this level is 1410.00. On a break from here our first target is 1300.00, this is 23.6% of the 2019 low and the long term swing point is 1200.00, this is 38.2% back to the same low. With a solid close above (10 to 15 cents) look for the long term target of 1588.50, this is 78.6% back to the all-time high and a major Gann square. There is one other major Gann square at 1512.00 to look for resistance.
Short term the break from 1463.00 has held 38.2% back to the 1/25/21 low on a closing basis, this level is 1400.00, provided they stay above it look for new highs, on a failure to hold it look for 61.8% of the same move at 1360.00, this is also a major Gann square.
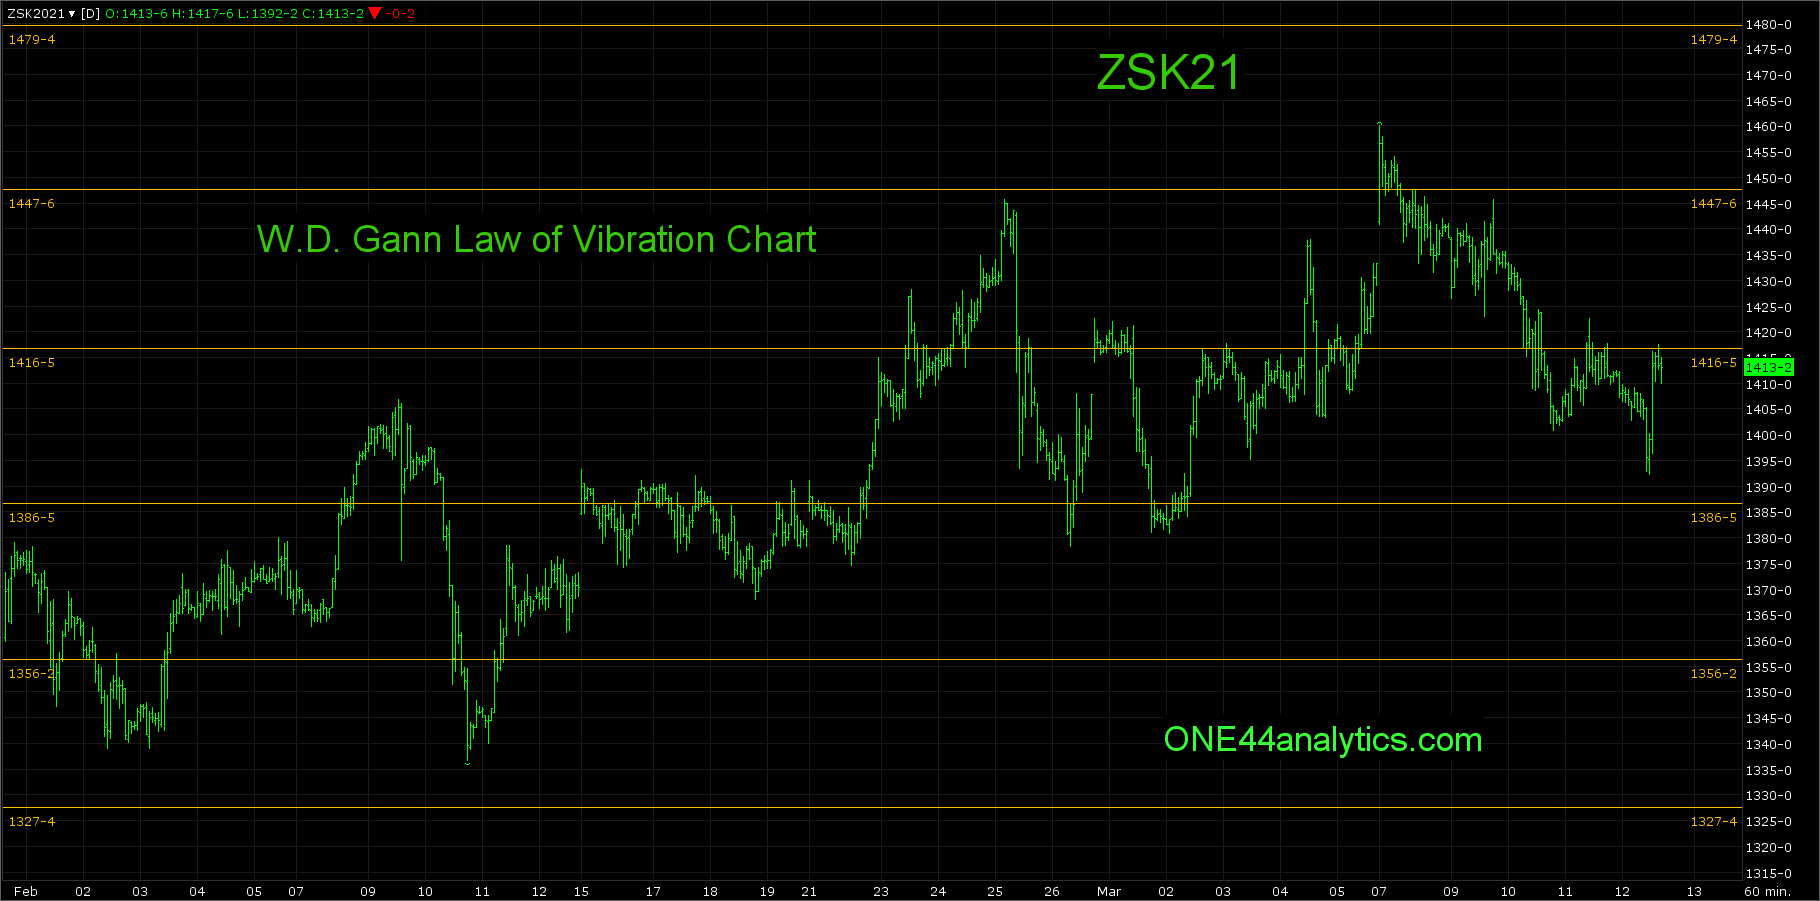
You can also use the W.D. Gann Law of Vibration chart below for short term support and resistance, these are marked by the yellow horizontal lines.
Sign up for our Free newsletter here.
This is our latest video in an ongoing series of how to use the Fibonacci retracements. Even if you do not trade the market covered the rules and guidelines are the same, as we believe the Fibonacci retracements are the underlying structure of all markets.
https://www.youtube.com/watch?v=8THwUxnhrvE&t=472s&ab_channel=ONE44Analytics