Soybeans and Corn top
ONE44 Analytics where the analysis is concise and to the point
Our goal is to not only give you actionable information, but to help you understand why we think this is happening based on pure price analysis with Fibonacci retracements and Gann squares.
You can get all the rules and guidelines to the Fibonacci retracements on our website
Soybeans and Corn
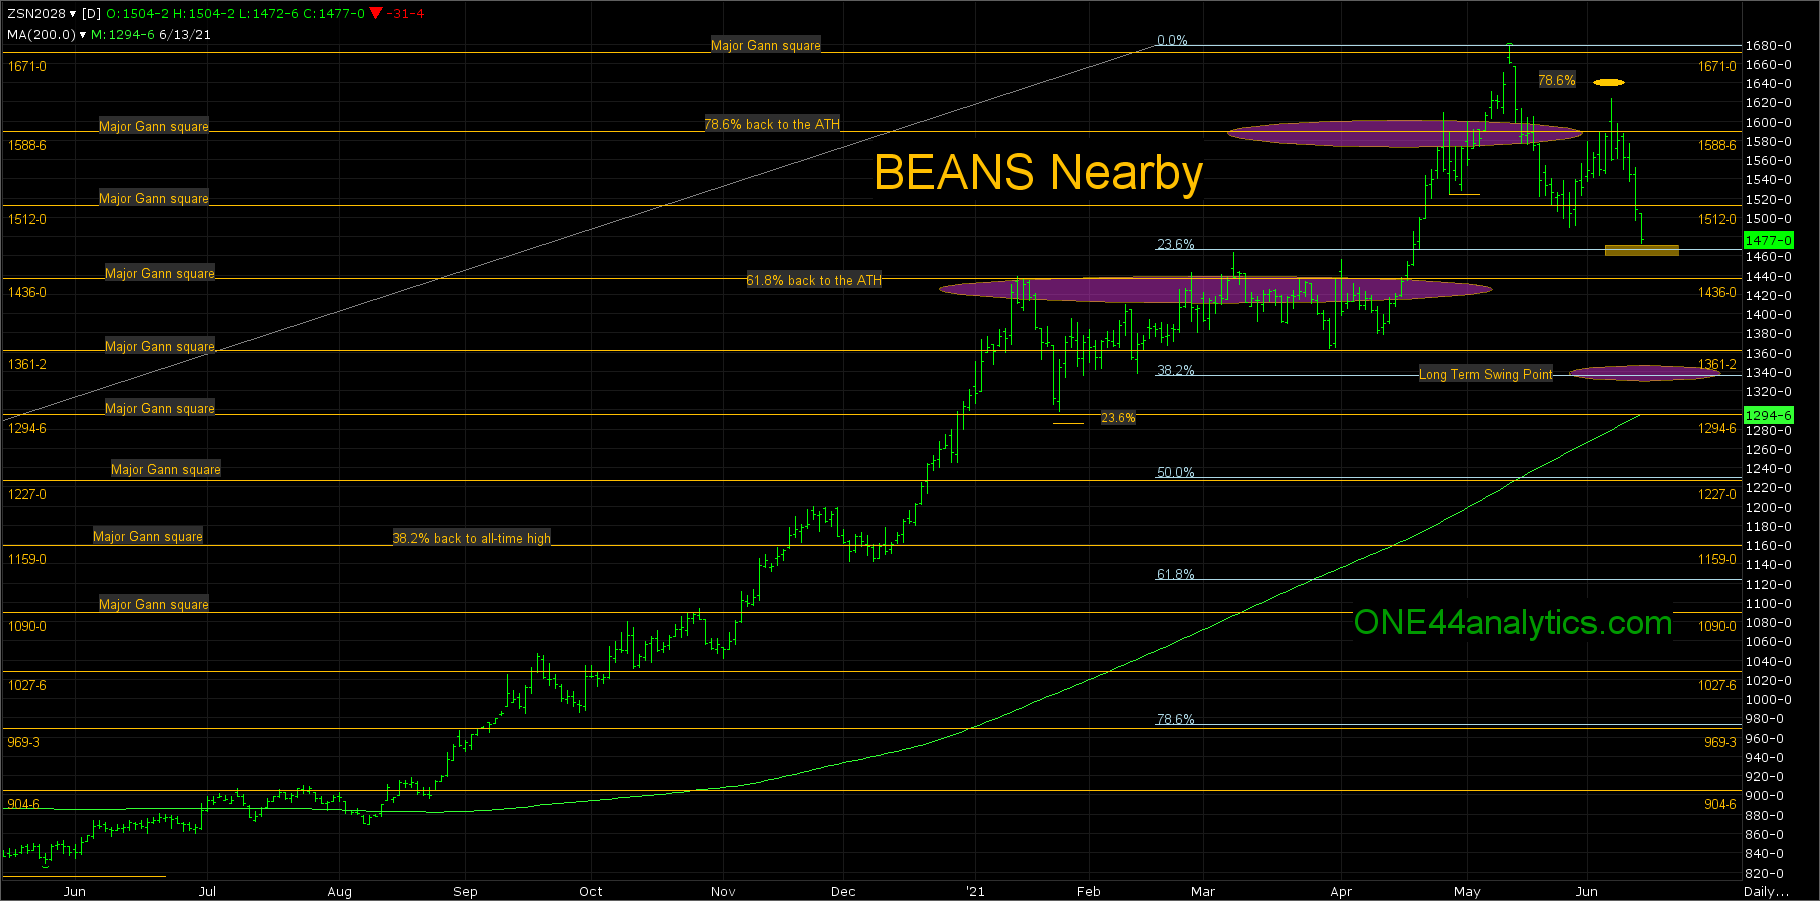
In our update on June 6th we warned that while the Soybeans and Corn had done nothing so far to turn the trend lower you would have to watch the 78.6% levels on the rally.
"This is a retracement that ends a lot of bull runs, as well as starting bull runs when it happens at the lows."
The level in Soybeans was 1636.00, they fell short of this, but the effect was the same. The break from this area has now taken them down to 1474.00, this is just above 23.6% back to the 2019 low, that is 1468.00, this will be key for Monday's close. They can trade below it, but must close back above it to keep the market very positive, if so look for new highs, With a solid close below 1468.00, the target is the long term swing point at 1338.00, this is 38.2% back to the 2019 low, if this level gets taken out the high for the year is most likely in and you can look for 61.8% at 1120.00.
In Corn 78.6% was 709.50, this was also a major Gann square. Thursday's high was above it, however it closed below and now has setback 50 cents so far. If the break from 709.5 can only go back to 23.6% again at 633.00, look for a rally to retest the hgh. Since they already reacted to 23.6% it is more likely they go for the long term swing point at 575.00. This is 38.2% back to the 2020 low and the level that must hold to keep the long term trend positive.
