Soybeans have taken out their long term swing point, is Corn next
ONE44 Analytics where the analysis is concise and to the point
Our goal is to not only give you actionable information, but to help you understand why we think this is happening based on pure price analysis with Fibonacci retracements, that we believe are the underlying structure of all markets and Gann squares.
For the ONE44 Fibonacci rules and guidelines to help with this article, go here.
Charts are courtesy of Barchart.com
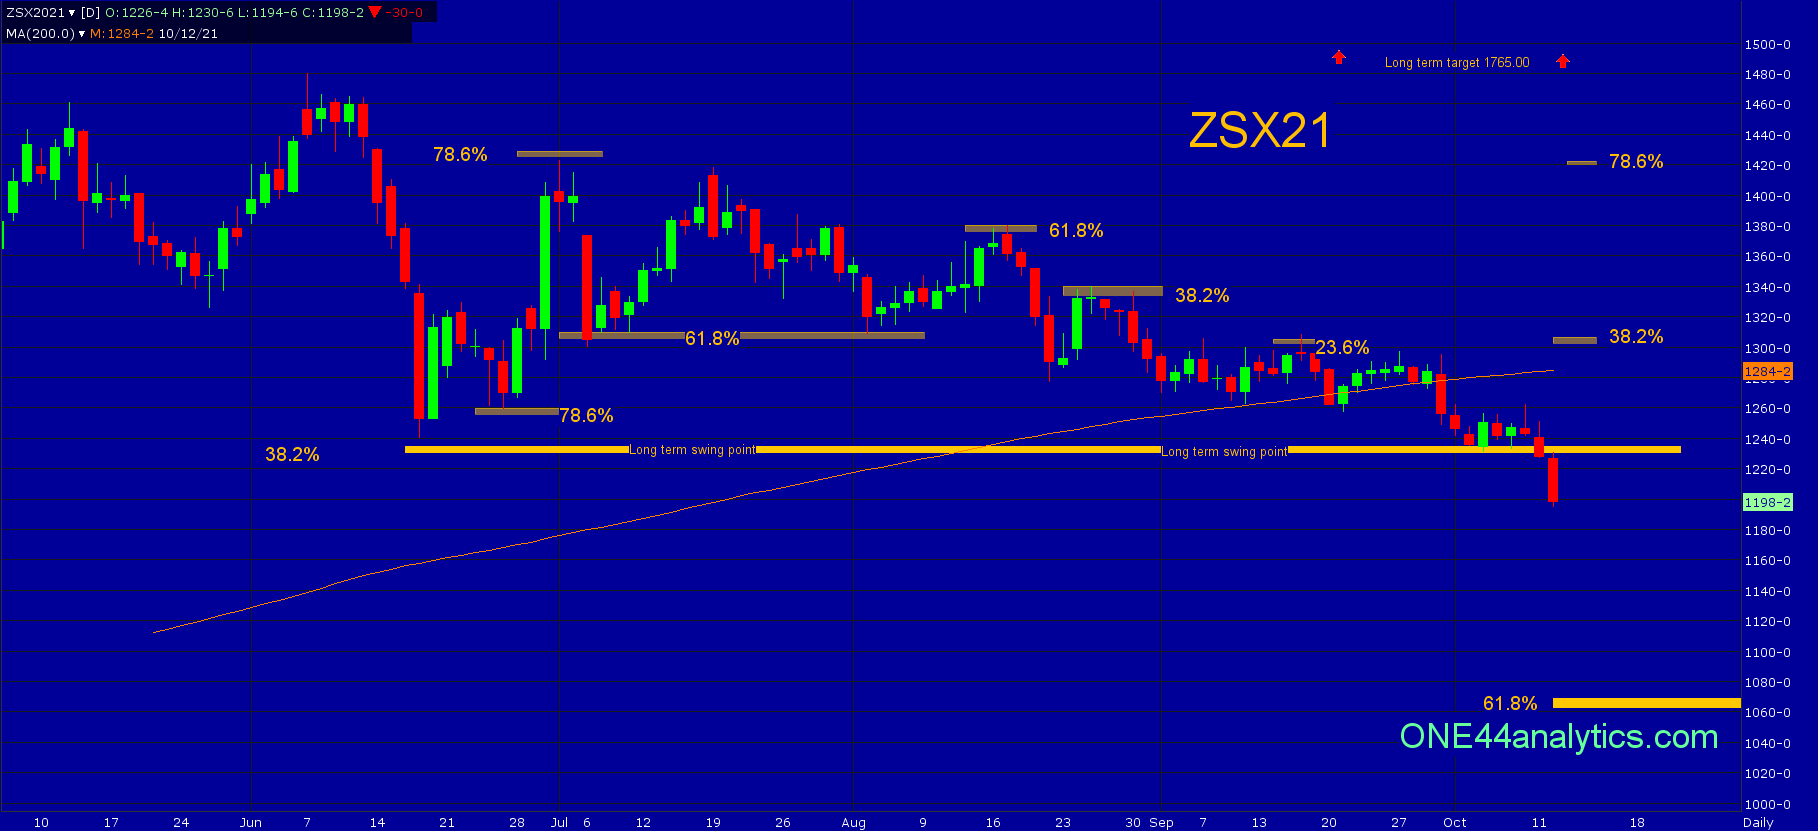
Soybeans
Beans have now taken out the long term swing point of 1235.00, this was 38.2% of the contract high and low. Following the ONE44 38.2% rule, once it is taken out the next target becomes 61.8% of the same move and this is 1070.00.
The short term view told the story of a weakening market after making the contract high. The high on 7/1/21 was 78.6% and following the 78.6% rule we know this is where a lot of Bull runs end and start. The high on 8/17/21 could only rally 61.8% and the high on 8/25/21 hit 38.2%. The final attempt to rally before taking out the long term swing point went 23.6% on 9/16/21.
With the amount of time spent above the long term swing point without making a new high tells us it can be a quick move down to 61.8%. It could look like the break from the contract high to the long term swing point back in June. It would concern me if it just hangs around here just below 1235.00, this is a major level and the move away from it should be swift.
The hope for the long side of the market is that they get right back above 1235.00 and even then it would have to get above 38.2% (1302.00) back to the contract high to turn the short term positive. Provided this did happen you can then start to look at the long term targets again.
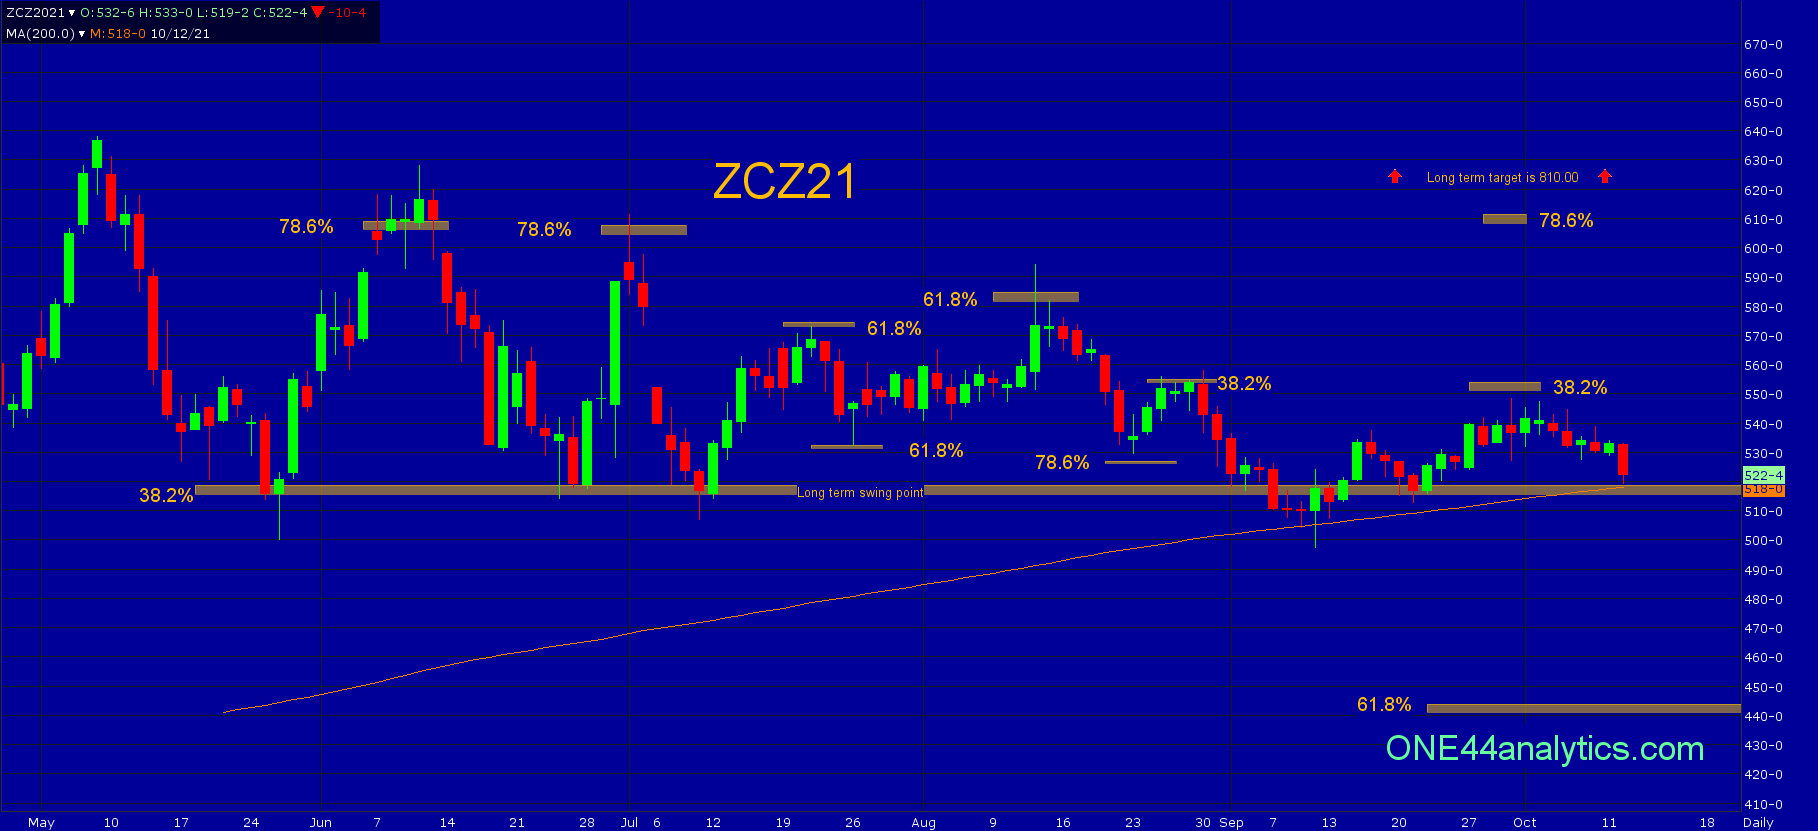
Corn
The low today was right on the long term swing point and the 200 day moving average of 518.00. Like the Soybeans each successive high since June hit a lower retracement. The last one fell just short of 38.2% at 550.00 on 9/30/21 keeping the short term negative.
It has traded below the long term swing point a few times only to recover quickly, however this time the 200 day average is at the same price making it even more important. Holding this area once again will keep the long term positive, but it needs to take out 38.2% at 550.00 to turn the short term positive again. Provided that happens, look to the long term targets above.
Taking out 518.00 (38.2%) will give us a downside target of 61.8% at 445.00. This target could be achieved just as quickly as we think it can be in the Soybeans.
Sign up for our Free newsletter here.
FULL RISK DISCLOSURE: Futures trading contains substantial risk and is not for every investor. An investor could potentially lose all or more than the initial investment. Commission Rule 4.41(b)(1)(I) hypothetical or simulated performance results have certain inherent limitations. Unlike an actual performance record, simulated results do not represent actual trading. Also, since the trades have not actually been executed, the results may have under- or over-compensated for the impact, if any, of certain market factors, such as lack of liquidity. Simulated trading programs in general are also subject to the fact that they are designed with the benefit of hindsight. No representation is being made that any account will or is likely to achieve profits or losses similar to those shown. Past performance is not necessarily indicative of future results.