Soybeans on the run!
ONE44 Analytics where the analysis is concise and to the point
Our goal is to not only give you actionable information, but to help you understand why we think this is happening based on pure price analysis with Fibonacci retracements, that we believe are the underlying structure of all markets and Gann squares.
For the ONE44 Fibonacci rules and guidelines to help with this article, go here.
Charts are courtesy of Barchart.com
This is our latest video in an ongoing series of how to use the Fibonacci retracements. Even if you do not trade the market covered, the ONE44 rules and guidelines are the same, as we believe the Fibonacci retracements are the underlying structure of all markets.
https://youtu.be/HEyLVbjvHDg
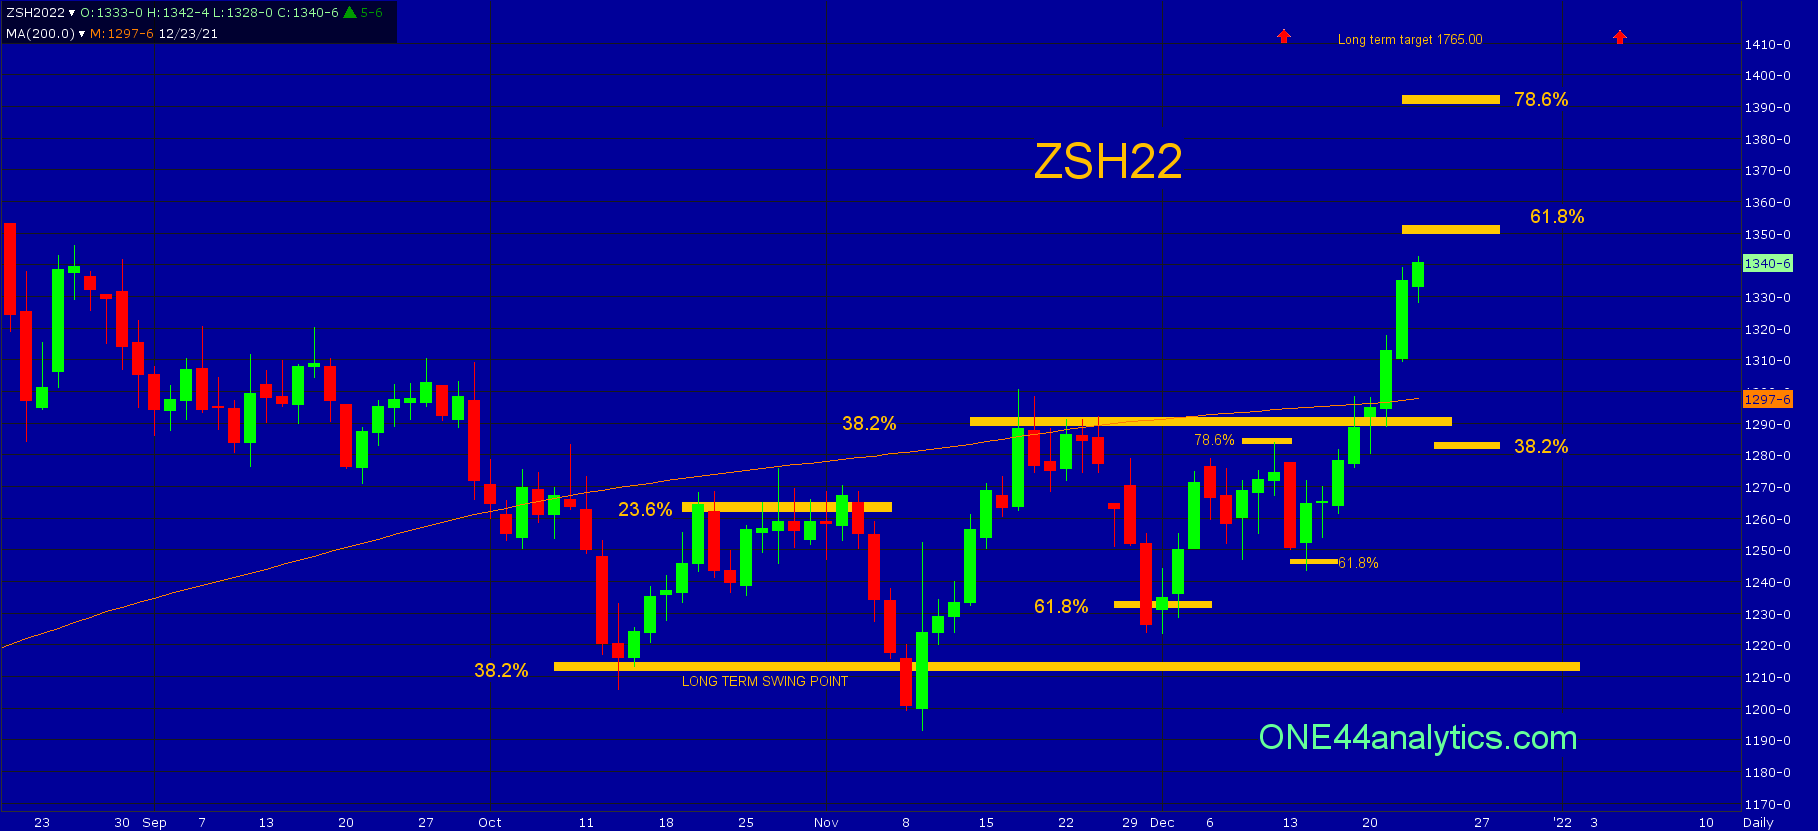
Soybeans
(ZSF22) (ZSH22) (ZSK22) (ZSN22) (ZSX22)
We will start with the long term swing point at 1214.00, this is 38.2% of the contract high and low, as long as it remains above this the long term trend remains positive and new contract highs are the target from it. When it first hit this level back on 10/13/21 the rally from it could only go 23.6% back to the contract high, this was 1263.00. This kept the short term trend negative and sent it back to the long term swing point again on 11/8/21. There was one close below 1214.00 (we always want to see two in a row to violate a level) and the next day it was right back above it.
The next rally took it to 38.2% of the contract high on 11/17/21 at 1290.00, not getting above here kept the short term trend negative again. The failure to make a new low after hitting 38.2% is usually a sign that the trend is turning. The break from 1290.00 went to just below 61.8% at 1232.00, it had one close below it and the next day right back above it. It also stayed well above the long term swing point. This was the start of the next leg up, it stopped at 78.6% at 1283.00 on 12/10/21 and the break from there held 61.8% at 1046.00 on 12/14/21 making a higher low. The rally from it pushed it through 38.2% at 1290.00 turning the short term trend positive and getting back in sync with the long term trend.
Even with the short and long term trend being positive and new contract highs being the long term target, we have to watch all the retracements on this rally to see just how strong, or weak the market is. The next level is 61.8% at 1350.00, provided it did stop here the target would be 61.8% following the ONE44 Fibonacci rules and guidelines, this level is yet to be determined. Once they can clear 1350.00 look for 78.6% at 1390.00.
When you look at the May and July contracts the market looks even stronger, with the July contract already above 61.8% back to the contract high. The November has traded more sideways for the past five months, but it is well above their long term swing point and in an even stronger position. We have been saying since the fall of last year this can be a multi-year rally and that our very long term target is 1765.00. Here is one of the posts about this, https://www.one44analytics.com/soybeans-update-3/
You can find the Corn and Wheat updates on our website tomorrow.
Sign up for our Free newsletter here.
FULL RISK DISCLOSURE: Futures trading contains substantial risk and is not for every investor. An investor could potentially lose all or more than the initial investment. Commission Rule 4.41(b)(1)(I) hypothetical or simulated performance results have certain inherent limitations. Unlike an actual performance record, simulated results do not represent actual trading. Also, since the trades have not actually been executed, the results may have under- or over-compensated for the impact, if any, of certain market factors, such as lack of liquidity. Simulated trading programs in general are also subject to the fact that they are designed with the benefit of hindsight. No representation is being made that any account will or is likely to achieve profits or losses similar to those shown. Past performance is not necessarily indicative of future results.