Soybeans Update
ONE44 Analytics where the analysis is always concise and to the point
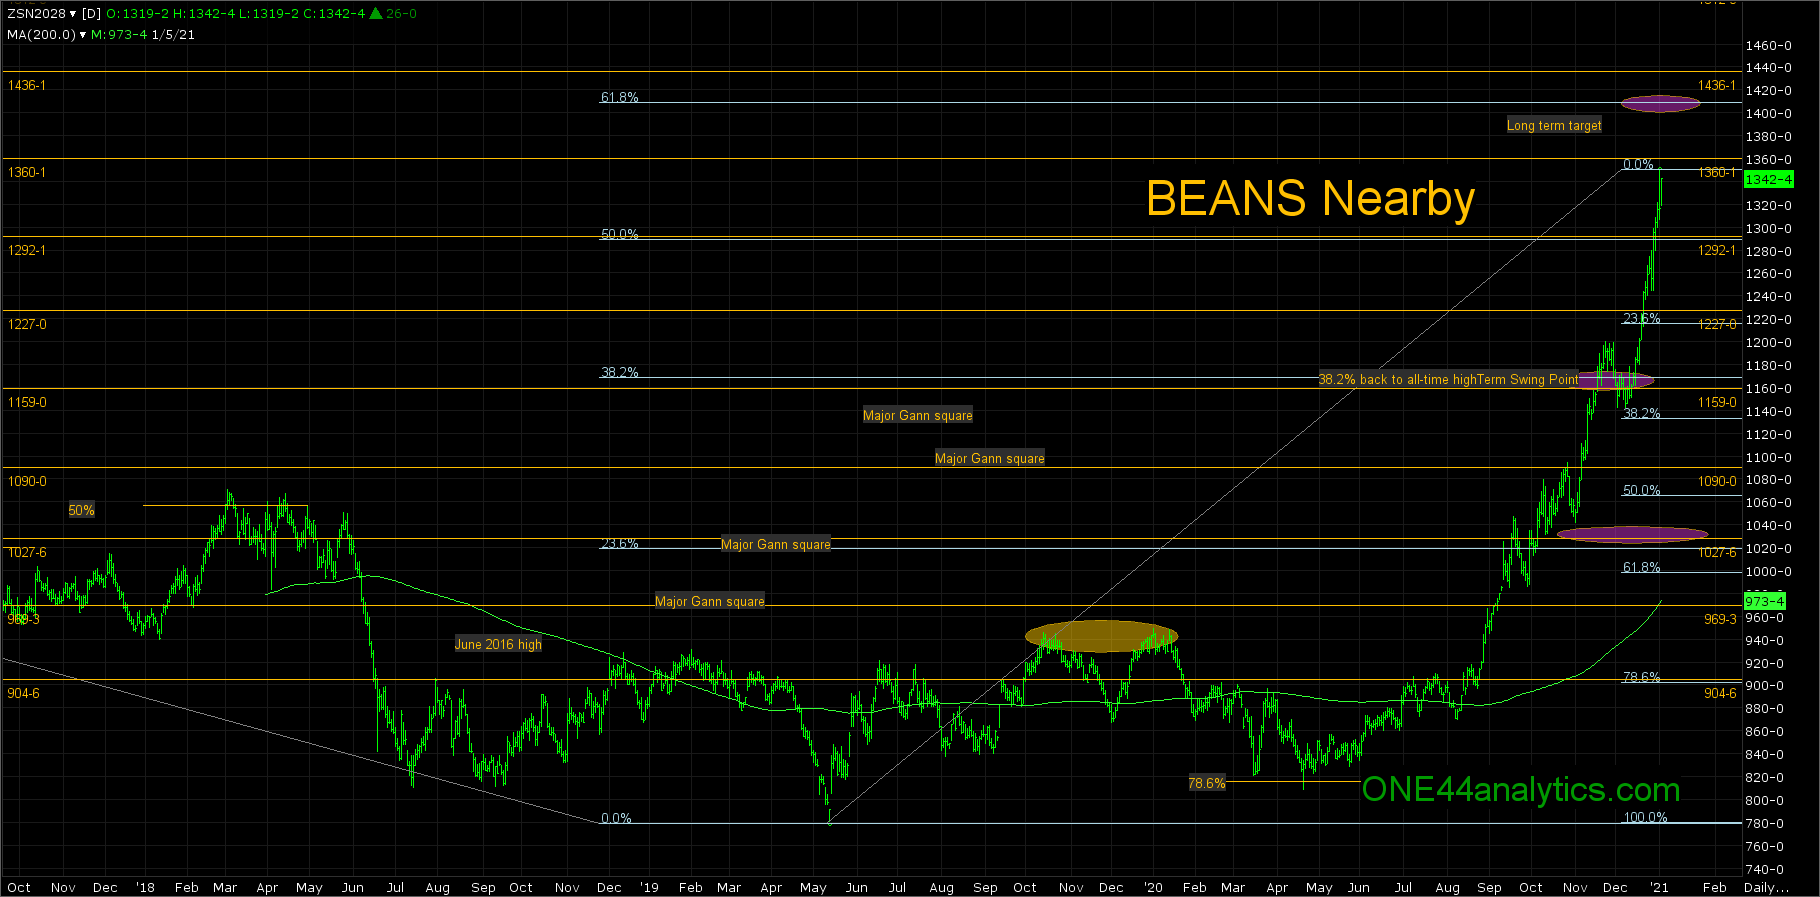
Soybeans
The rally we had anticipated back in the summer of 2020 continues on with the majority of the hesitations at the major retracements back to the All-time high. The first area was 1030.00, this was 23.6% back to it, they initially broke from it and then once above it found it as support before going to our next long term target of 1170.00. This was 38.2% back to the ATH, they spent two weeks above it then two weeks below it before getting back above it and the 1200.00 previous high, which then gave us our next and current target of 1410.00.This is 61.8% back to the ATH. Normally when a retracement gets taken out we don't follow it anymore, however when these levels are from the extreme levels, such as the ATH, or ATL you have to keep an eye on them and the same rules/guidelines apply. You can find these here.
To find support on any setback retrace the current high back to the lows on 12/8/20 and 9/29/20 and apply the same rules and guidelines as if they were major retracements. The long term swing point remains at 1170.00.
Use the major Gann squares, marked by the yellow horizontal lines on the daily charts for support and resistance in between these major Fibonacci retracements. They can also be used as swing points and targets. The same thing for the secondary Gann squares on the Hourly chart below.