The coming setback in Hogs and Cattle, Part 2
ONE44 Analytics where the analysis is concise and to the point
Our goal is to not only give you actionable information, but to help you understand why we think this is happening based on pure price analysis with Fibonacci retracements, that we believe are the underlying structure of all markets and Gann squares.
Livestock
In our post on 9/21/22 called "The coming top in Hogs and Cattle" we gave you the reasoning behind why we thought the top was in for the time being.
In Hogs, it ended up being a $16.00 break into the long term swing point.
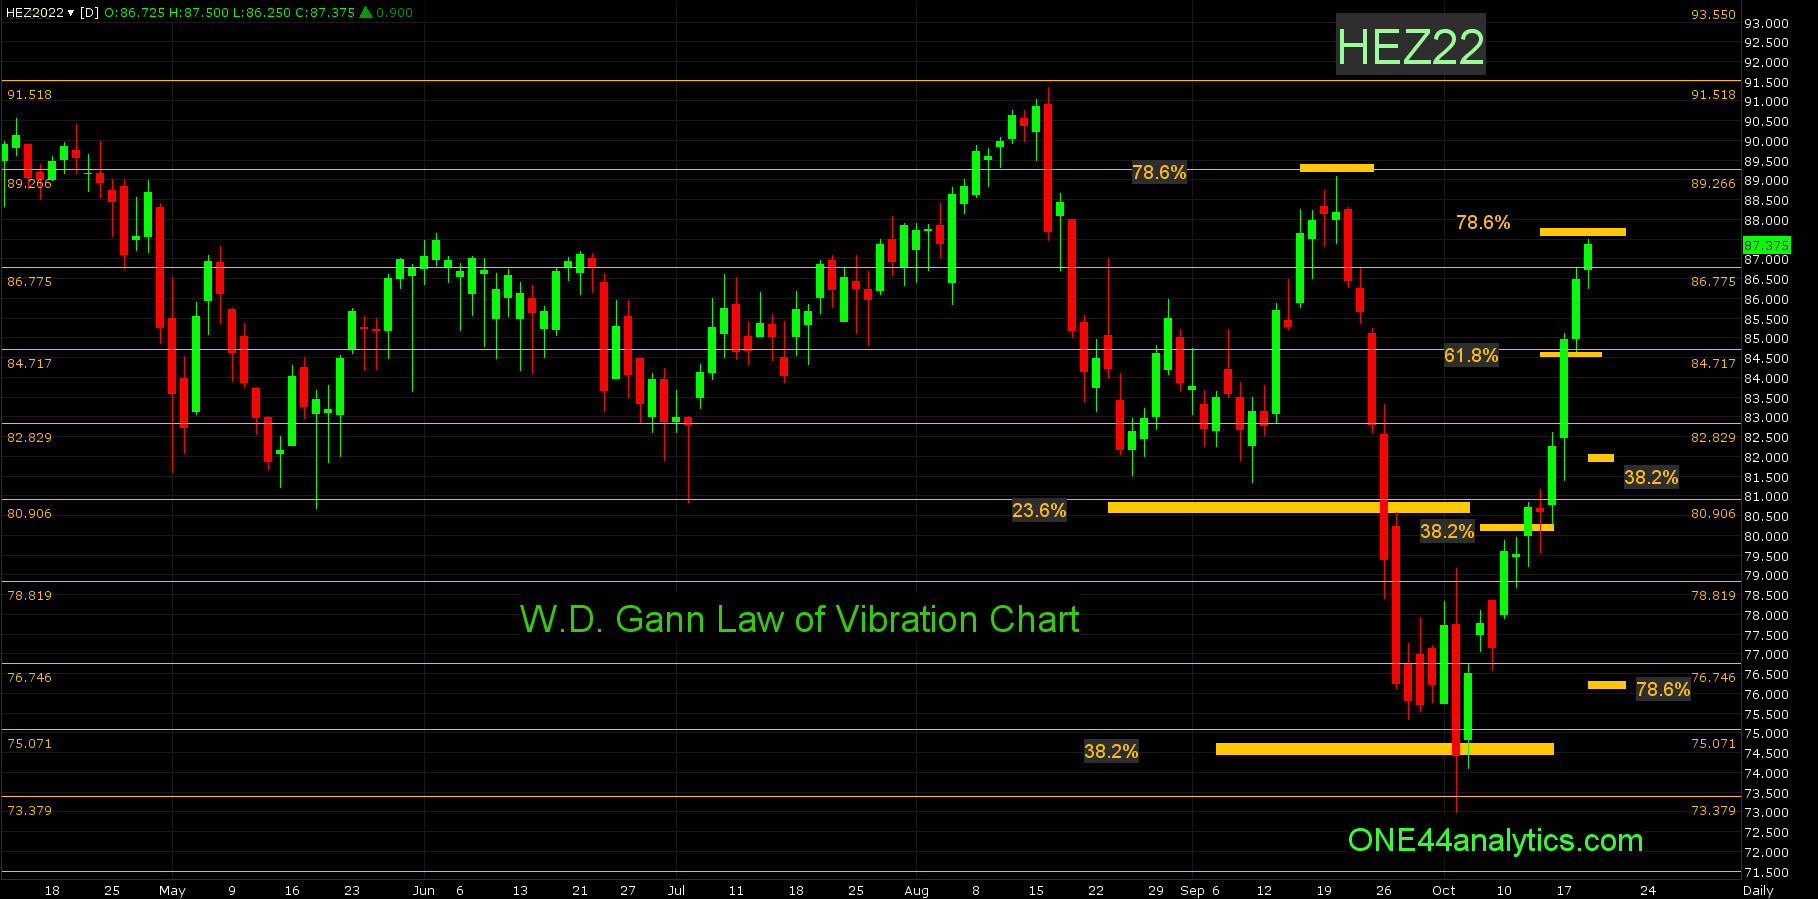
At the bottom we posted this on 10/5/22,
Holding the long term swing point can send this market on a big rally, even as high as 87.60, this is 78.6% of the break, however the first test of the strength of this market will be at 38.2% at 80.10, this will be the short term target on a rally from 74.50.
In last Friday's update we said,
The rally after holding the long term swing point of 74.75 and hitting the 73.37 major Gann square has indeed sent this market on a big rally. It already has taken out 38.2% of the break at 80.10, turning the short term trend positive and longer term we still think it can get up to 78.6% of the break at 87.60. There is one level before this of importance and it is because 61.8% at 84.50 matches up nicely with the 84.71 major Gann square. A break from this area can send it 61.8% the other way, this is yet to be determined.
We did warn that turning lower from 61.8% at 84.50 could send this market 61.8% the other way and as you can see on the chart, there was no attempt to turn lower from there and now the rally from 74.50 has been 11 trading days and hit 87.50 today.
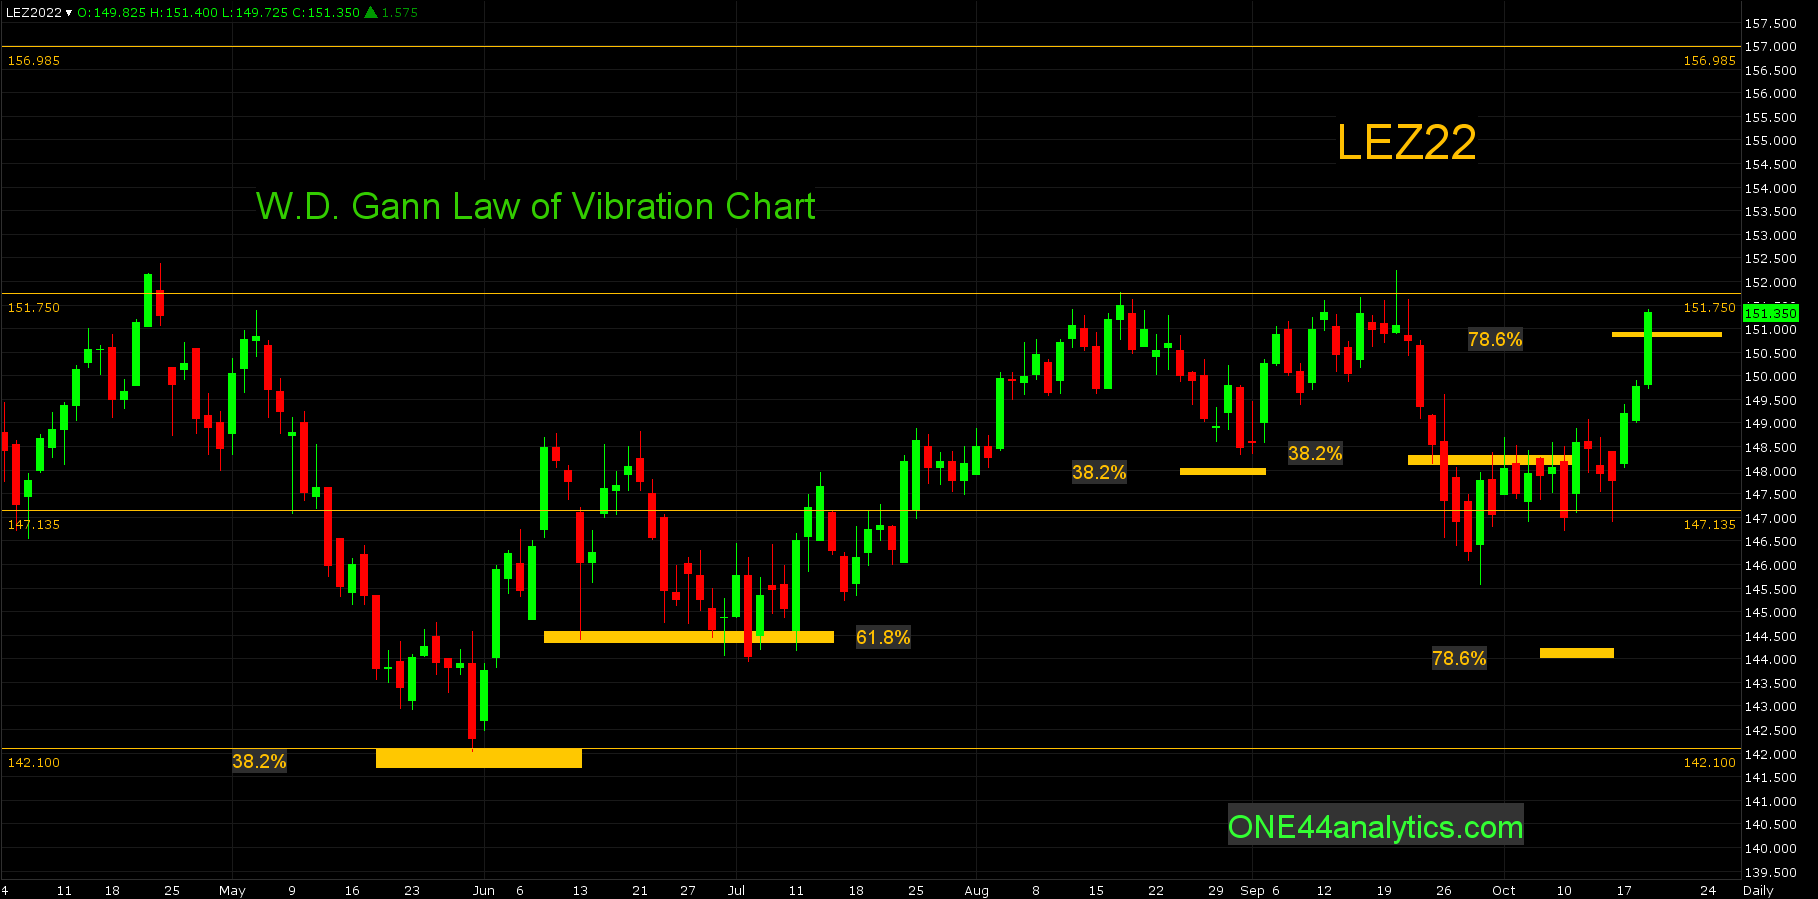
The top in Cattle on 9/20/22 setback from the 151.75 major Gann square to 145.60. On 10/5/22 we posted this,
Use 147.13 major Gann square as the swing point. Above it, look for the 151.75 major Gann square. Below it, look for 144.00.
and on 10/16/22 we said,
This week so far has sat on the 147.13 major Gann square. We will continue to use this as the swing point. Above it, look for 78.6% back to the high at 150.85. Below it, look for 144.00, this is 78.6% of the 9/20/22 high and 5/31.22 low. On an extended break look for the area of the 137.65 major Gann square and 23.6% back to the 2020 low at 137.20. Once above the 151.75 major Gann square we will look for the next one at 156.98.
Using the retracements this week's target was 150.85 and with the major Gann squares it was 151.75. Today they split these levels.
The coming top in Hogs and Cattle, part 2 is more about the Hogs, unless Cattle was to hit the 151.75 major Gann square (or trade above it) and then close below 78.6% at 150.85. Provided this did happen, we would look for a quick move back to the 147.15 major Gann square. It has already reacted from the 151.75 major Gann square 3 times before, so if they get a solid close above it, we will look for the next major Gann square at 156.98.
In the Hogs we have hit 78.6% (87.60 -.10) and using the ONE44 78.6% rule, the long term target on a break from here will be 78.6% the other way at 76.32. The short term target is 38.2% at 82.10. It can still trade above 87.60, however we would want to see a close back below it for the break to happen. Any setback from this area that holds 23.6% at 84.15 keeps the trend very positive and you can look for new highs for this leg and then the 91.52 major Gann square, this will also be the target on a failure to turn lower from 87.60.
If you like this kind of analysis and trade the Grains, take a look at our Grains Weekly updates on our website.
FULL RISK DISCLOSURE: Futures trading contains substantial risk and is not for every investor. An investor could potentially lose all or more than the initial investment. Commission Rule 4.41(b)(1)(I) hypothetical or simulated performance results have certain inherent limitations. Unlike an actual performance record, simulated results do not represent actual trading. Also, since the trades have not actually been executed, the results may have under- or over-compensated for the impact, if any, of certain market factors, such as lack of liquidity. Simulated trading programs in general are also subject to the fact that they are designed with the benefit of hindsight. No representation is being made that any account will or is likely to achieve profits or losses similar to those shown. Past performance is not necessarily indicative of future results.