This is another Viewer Request for analysis on the U.S. Dollar using the ONE44 Fibonacci retracements
ONE44 Analytics where the analysis is concise and to the point
Our goal is to not only give you actionable information, but to help you understand why we think this is happening based on pure price analysis with Fibonacci retracements, that we believe are the underlying structure of all markets and Gann squares.
Here is a quick set of guidelines for the Fibonacci retracements to help with this article. You can find all the rules/guidelines and examples on any deviations from these four basic rules on our website.
1) The Golden rule, any market that is going to continue the current trend must hold 38.2% and a new high/low should follow.
2) Markets that are extremely strong/weak will only go 23.6% and a new high/low should follow. Typically a runaway market.
3) The 61.8% rule is, any market that holds 61.8% should go 61.8% of where it just came from. Usual happens when a market is directionless, or in a consolidation period.
4) The 78.6% rule is, any market that holds 78.6% should go 78.6% of where it just came from. This is also where a lot of Bull markets end and start.
Charts are courtesy of Barchart.com
This is another Viewer Request for the U.S. Dollar based on the ONE44 Fibonacci retracements
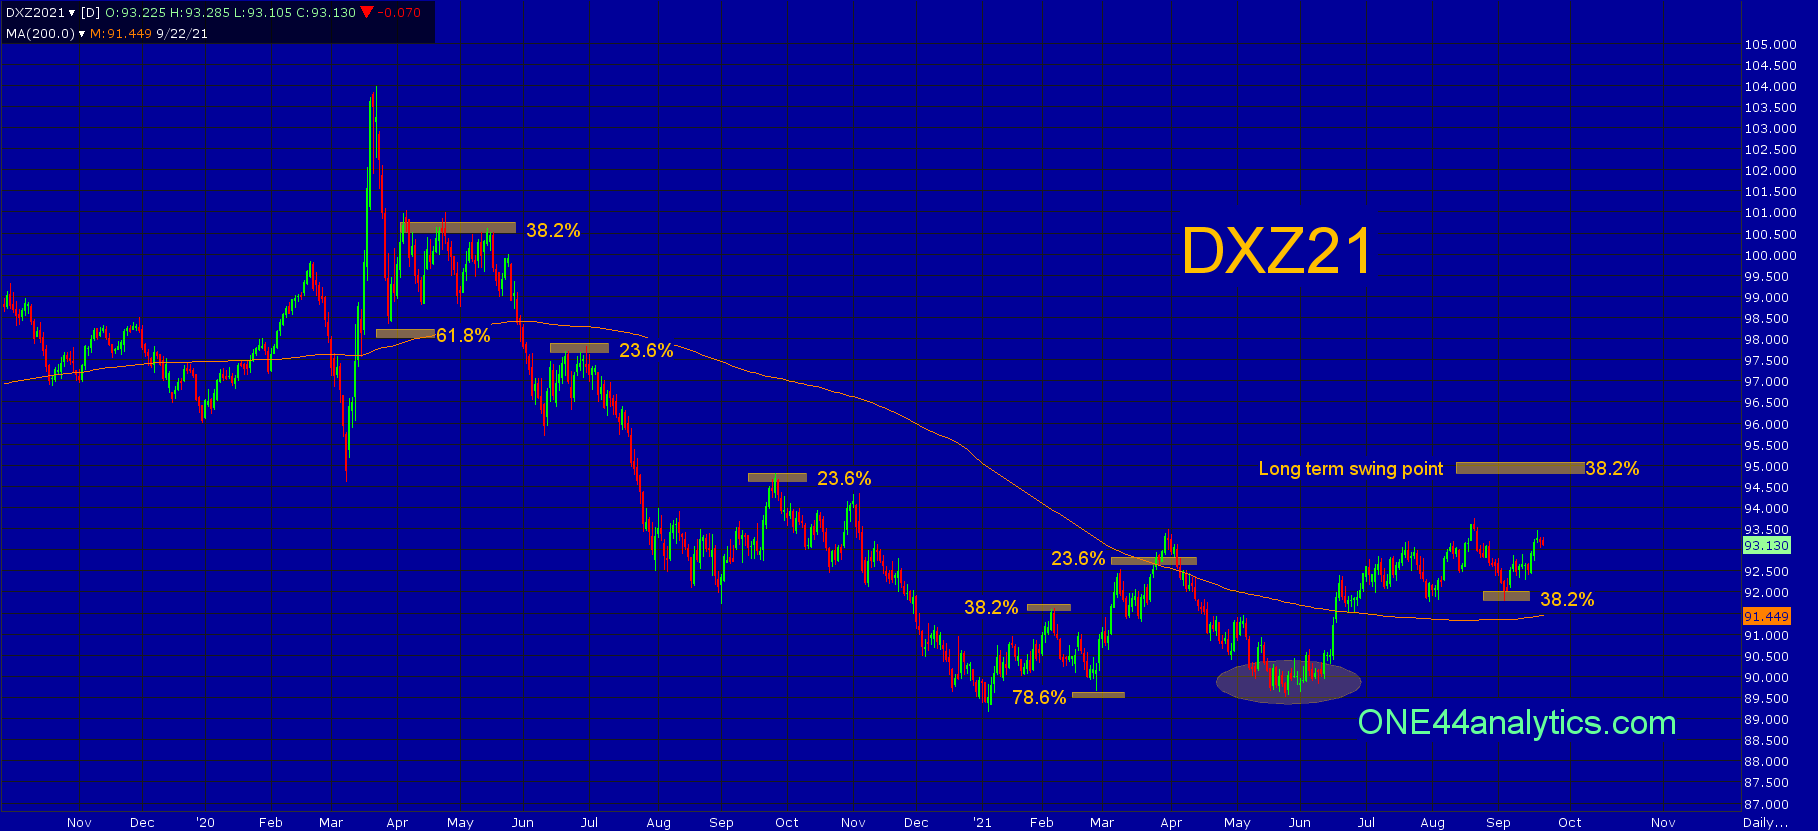
Going back to the high for 2020 at 103.96, the first break from it took it to 61.8% of the 3/9/20 low. We would normally be looking for 61.8% back up based on the ONE44 Fibonacci 61.8% rule, however it could not stay above 38.2% to the years high and new lows followed. The next rally from the 6/10/20 low could only rally 23.6%, this happened on 6/19/20 and 7/1/20. As rule #2 says, Markets that are extremely strong/weak will only go 23.6% and a new high/low should follow. Typically a runaway market.
The break from 23.6% went down to 92.23 on 9/2/20. The rally from there was again only able to get to 23.6% back to the year's high, keeping the trend very negative. The low for the move came on 1/6/21 at 89.16.
When any market can't even get to 23.6% of the bigger move you have to start using lower highs to retrace to. In this case we used the high that last hit 23.6% on 9/25/20. The next rally hit 38.2% of it on 2/5/21 and then this is where the first sign of a trend change happened.
We know that when a market holds 38.2% it should go for new lows to keep the trend intact. It failed to make that new low and hit 78.6% of that rally and as the second part of the 78.6% rule says, "This is also where a lot of Bull markets end and start." This is being done on a very short term view, but still noteworthy. It did go on to new highs that took it up through 23.6% back to the 2020 high. It traded above this level for one week. When it did get back below 23.6% we would look for it to do what it should do as if it held it perfectly and that is new lows. It failed to do this and when it did the next target would be 38.2% ( long term swing point) of the same move, this is 94.75.
After failing to make the new low, you can see the market getting stronger when it held 38.2% back to the year's low on 9/3/21. The short term swing point is 92.00 and it will need to take out 94.75 to turn the long term trend positive.
We are looking for your input, if there is a stock, or futures market you would like to see us do Fibonacci analysis on, email the ticker symbol to [email protected]
We will update these on the ONE44 website along with posting them on Barchart.com
Sign up for our Free newsletter here.
FULL RISK DISCLOSURE: Futures trading contains substantial risk and is not for every investor. An investor could potentially lose all or more than the initial investment. Commission Rule 4.41(b)(1)(I) hypothetical or simulated performance results have certain inherent limitations. Unlike an actual performance record, simulated results do not represent actual trading. Also, since the trades have not actually been executed, the results may have under- or over-compensated for the impact, if any, of certain market factors, such as lack of liquidity. Simulated trading programs in general are also subject to the fact that they are designed with the benefit of hindsight. No representation is being made that any account will or is likely to achieve profits or losses similar to those shown. Past performance is not necessarily indicative of future results.