This is what caused the massive turnaround in the NASDAQ 100

ONE44 Analytics where the analysis is concise and to the point
Our goal is to not only give you actionable information, but to help you understand why we think this is happening based on pure price analysis with Fibonacci retracements, that we believe are the underlying structure of all markets and Gann squares.
For the ONE44 Fibonacci rules and guidelines to help with this article, go here.
Charts are courtesy of Barchart.com
NASDAQ100
In our last post "NASDAQ 100 targets" we started with...
In our last update on 1/19/22 "NASDAQ 100 holds key area overnight" we left off with...
Taking out 15,000 should mean a longer term top is in and if so, our long term target area will be 13,060 to 12,870, this is 23.6% back to the 2008 low, 38.2% back to the 2020 low and a major Gann square.
In this same post we showed you what setup this current break from the ATH.
And ended with...
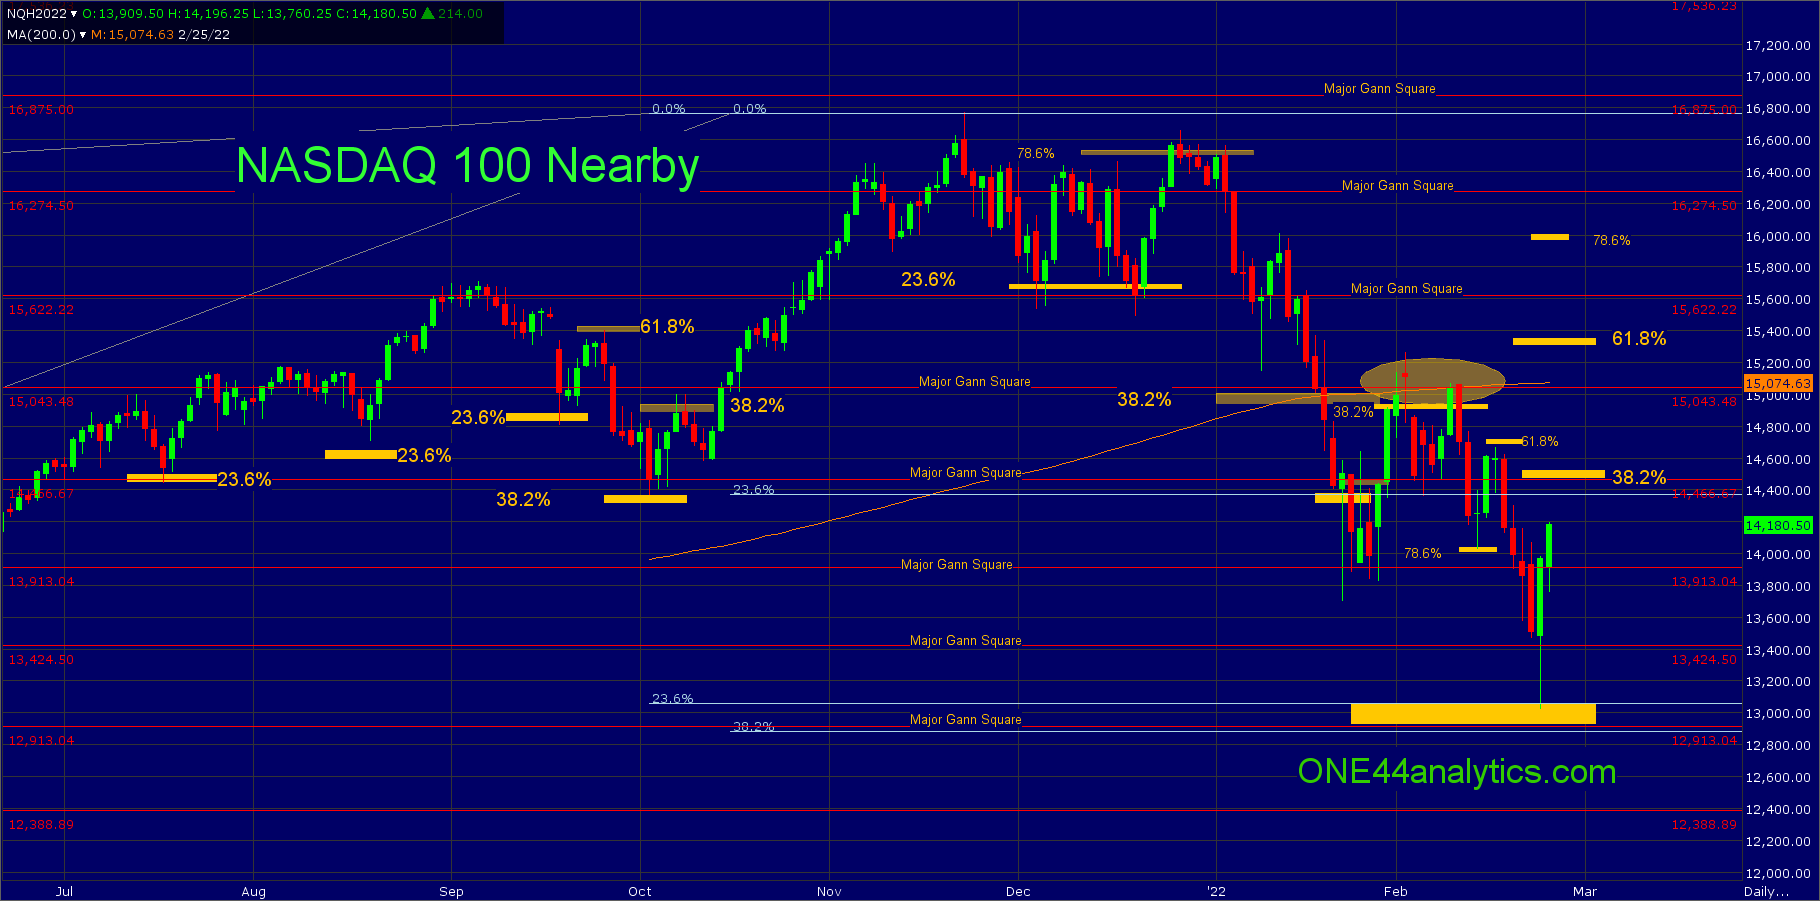
The short term trend will remain negative as long as any rally fails to close above 38.2% at 14,900, it can always trade above/below these levels, however it is the close that matters. Just above 14,900 is the 200 day average at 15,005 and a major Gann square at 15,043, so this will be a key area to overcome. Not getting above 23.6% at 14,400 is a very negative sign and it should quickly go for new lows. There is also a major Gann square at 14,466. As you can see on the chart below the red horizontal lines on it are major Gann squares and very good for using as swing points and targets. You will see a lot of highs and lows on these levels, here too the close is key to violating them.
As you can see on the chart below, they were unable to get through the 14,900 to 15,043 area. It did have one close above the 15,043 major Gann square on 2/2/22 (we always want to see two to violate the level) and retested it on 2/9/22. The break from the 2/9/22 high hit 78.6% on 2/14/22 and then up to 61.8% on 2/16/22, before the quick leg down into the major retracements mentioned above.
With 13,060 being 23.6% back to the 2008 low, we know following the ONE44 Fibonacci rules that holding 23.6% should send it to new highs longer term and holding above 12,870 which is 38.2% back to the 2020 low, it should also send it to new highs.
As always we watch all the retracements on every move to see just how strong, or weak the market is regardless of the long term target. So, looking at the short term trend that is down until it can take out 38.2% of the down move, we will be looking for 14,466, this is also a major Gann square, to see if the short term trend will turn positive to fall in line with the long term trend.
A failure to get above 38.2% will keep the short term trend negative and you can look for new lows from it and a much lower target from there. That will be updated when and if there is a new low. Taking out 38.2% will be a positive sign and the short term target will be 61.8% at 15,350.
Sign up for our Free newsletter here.
If you are looking for option plays to go with the ONE44 levels, we highly recommend going to the Barchart webinar library where John Rowland has plenty of information on Option strategies.
Here is one, Using the Long Strangle Options Strategy for Opportunity Trades
FULL RISK DISCLOSURE: Futures trading contains substantial risk and is not for every investor. An investor could potentially lose all or more than the initial investment. Commission Rule 4.41(b)(1)(I) hypothetical or simulated performance results have certain inherent limitations. Unlike an actual performance record, simulated results do not represent actual trading. Also, since the trades have not actually been executed, the results may have under- or over-compensated for the impact, if any, of certain market factors, such as lack of liquidity. Simulated trading programs in general are also subject to the fact that they are designed with the benefit of hindsight. No representation is being made that any account will or is likely to achieve profits or losses similar to those shown. Past performance is not necessarily indicative of future results.