TSLA 1089.00
ONE44 Analytics where the analysis is concise and to the point
Our goal is to not only give you actionable information, but to help you understand why we think this is happening based on pure price analysis with Fibonacci retracements, that we believe are the underlying structure of all markets and Gann squares.
For the ONE44 Fibonacci rules and guidelines to help with this article, go here.
Charts are courtesy of Barchart.com
In our previous TSLA update on 10/14/21 we left you with this,
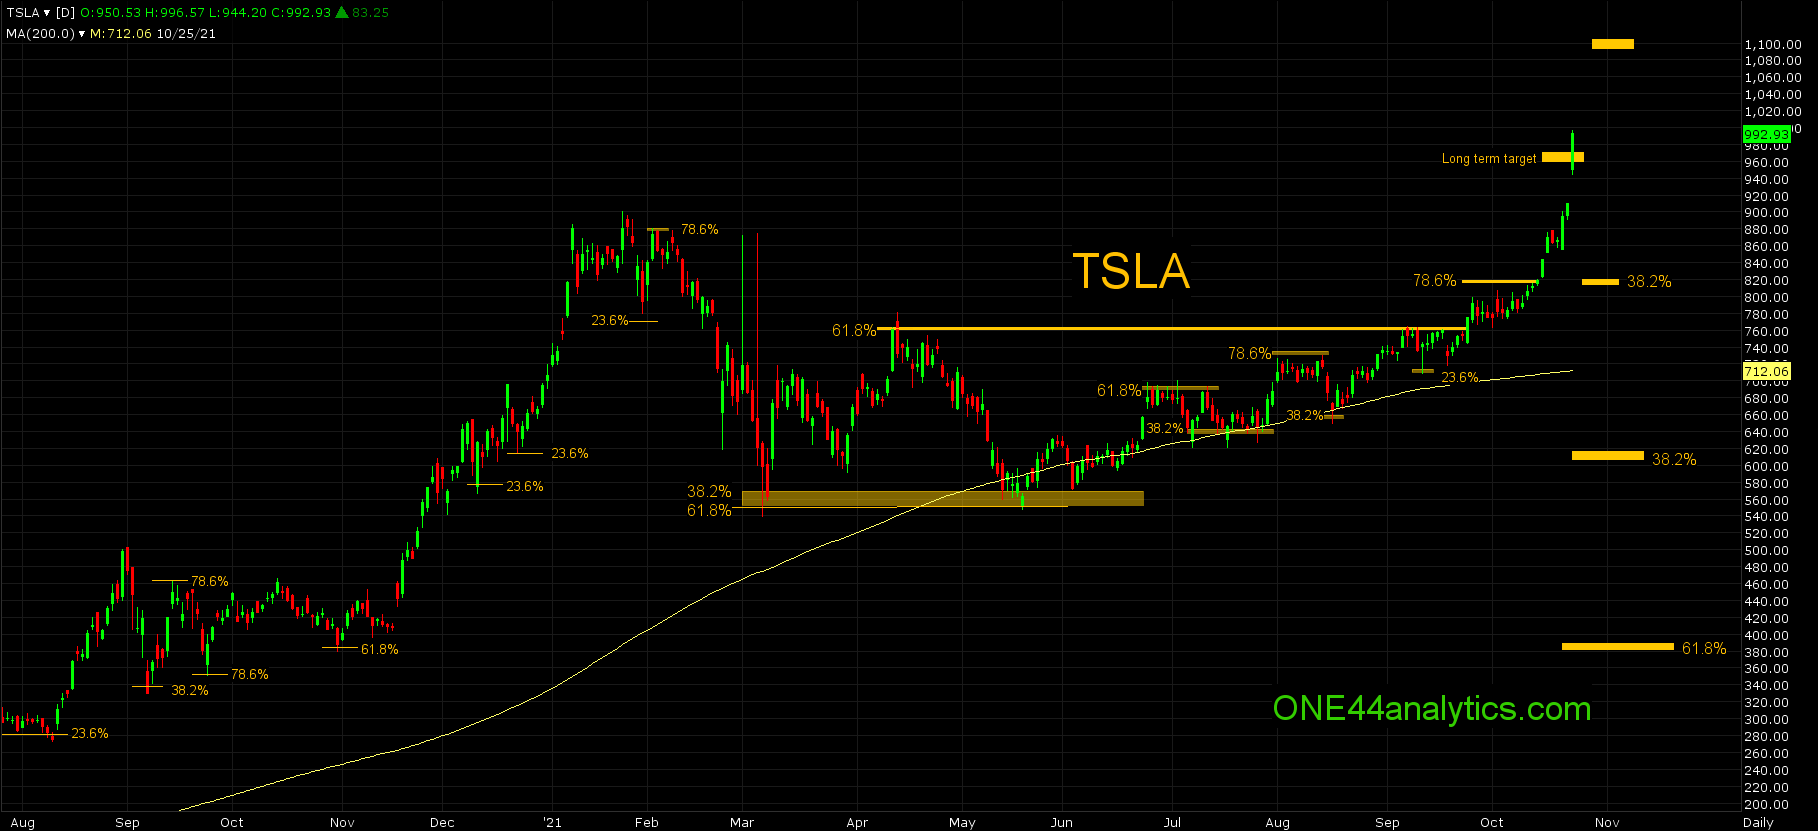
“On a failure to turn lower from 816.00 we have to go to the long term view for a target and this is 961.00. The long term trend remains positive until it can take out the March low that was 38.2% of the ATH and 3/18/20 low.”
It has now taken 7 trading days to hit the 961.00 long term target after failing to get any setback from 816.00. This huge move up was set up by the fact that it held the long term swing point back on 3/5/21. This was 38.2% of the ATH and ATL, it was also 61.8% back to the 9/8/20 low. After the retest of this area on 5/19/21 is when the move accelerated. The first setback after hitting 61.8% at 692.00 held 38.2% on 3 different days in July, this level was 637.00. It traded below it, but never closed below it keeping the short term trend intact. The rally from there took it to 78.6% on 8/2/21, the setback could only go 38.2% again on 8/17/21 and off it went on to new highs as it should after holding 38.2%. The next measurable setback happened on 9/13/21 and this time it could only go 23.6% and as the 23.6% rule states,
Extremely strong/weak markets will only go back 23.6%. This is Typically a runaway market.
and this is where things started to really accelerate.
With a close above 961.00, it will become our short term swing point, above it the next long term target is 1089.00. On a close below 961.00 look for 38.2% of the 3/5/21 low at 820.00.
Sign up for our Free newsletter here.
FULL RISK DISCLOSURE: Futures trading contains substantial risk and is not for every investor. An investor could potentially lose all or more than the initial investment. Commission Rule 4.41(b)(1)(I) hypothetical or simulated performance results have certain inherent limitations. Unlike an actual performance record, simulated results do not represent actual trading. Also, since the trades have not actually been executed, the results may have under- or over-compensated for the impact, if any, of certain market factors, such as lack of liquidity. Simulated trading programs in general are also subject to the fact that they are designed with the benefit of hindsight. No representation is being made that any account will or is likely to achieve profits or losses similar to those shown. Past performance is not necessarily indicative of future results.