TSLA, Fibonacci, Fibonacci, Fibonacci...

Tesla
In our previous update on 4/11/22 Without knowing what Elon Musk will say, or do next, the best way to follow TSLA is with the Fibonacci retracements and the ONE44 rules and guidelines.
We left you with this,
There was no turn lower at all from the 61.8% level at 1040.00 and as we just said above, without a turn lower from it to look for 78.6% at 1131.00. It did have one close above it, however we always want to see the second close to confirm the violation of a level. With the $160 break from 78.6% we have to go to the 78.6% rule to get a long term target and this would be 78.6% the other way at 800.00. As we always say we watch all the retracements on every move to see just how weak, or strong the market is regardless of the long term target. With that said the most important retracement is the 38.2% level, as this is what needs to hold to keep the current trend intact.
This morning's low hit 38.2% at 980.00, holding this level should send it back to make new highs for this run and keep the short term trend positive, we know the long term trend is positive, because that is where this rally started from on 2/24/22 and the long term target from it is a new ATH. On a failure to turn back up from 38.2% at 980.00 the next target is 61.8% at 872.00 and then the long term target of 78.6% at 800.00 based on the 78.6% level above at 1131.00. A rally from 980.00 that fails to make a new high above 1152.87 would be a negative sign, especially if it stops up at 78.6% of the current break. With today's low, this would be 1115.00.
Today
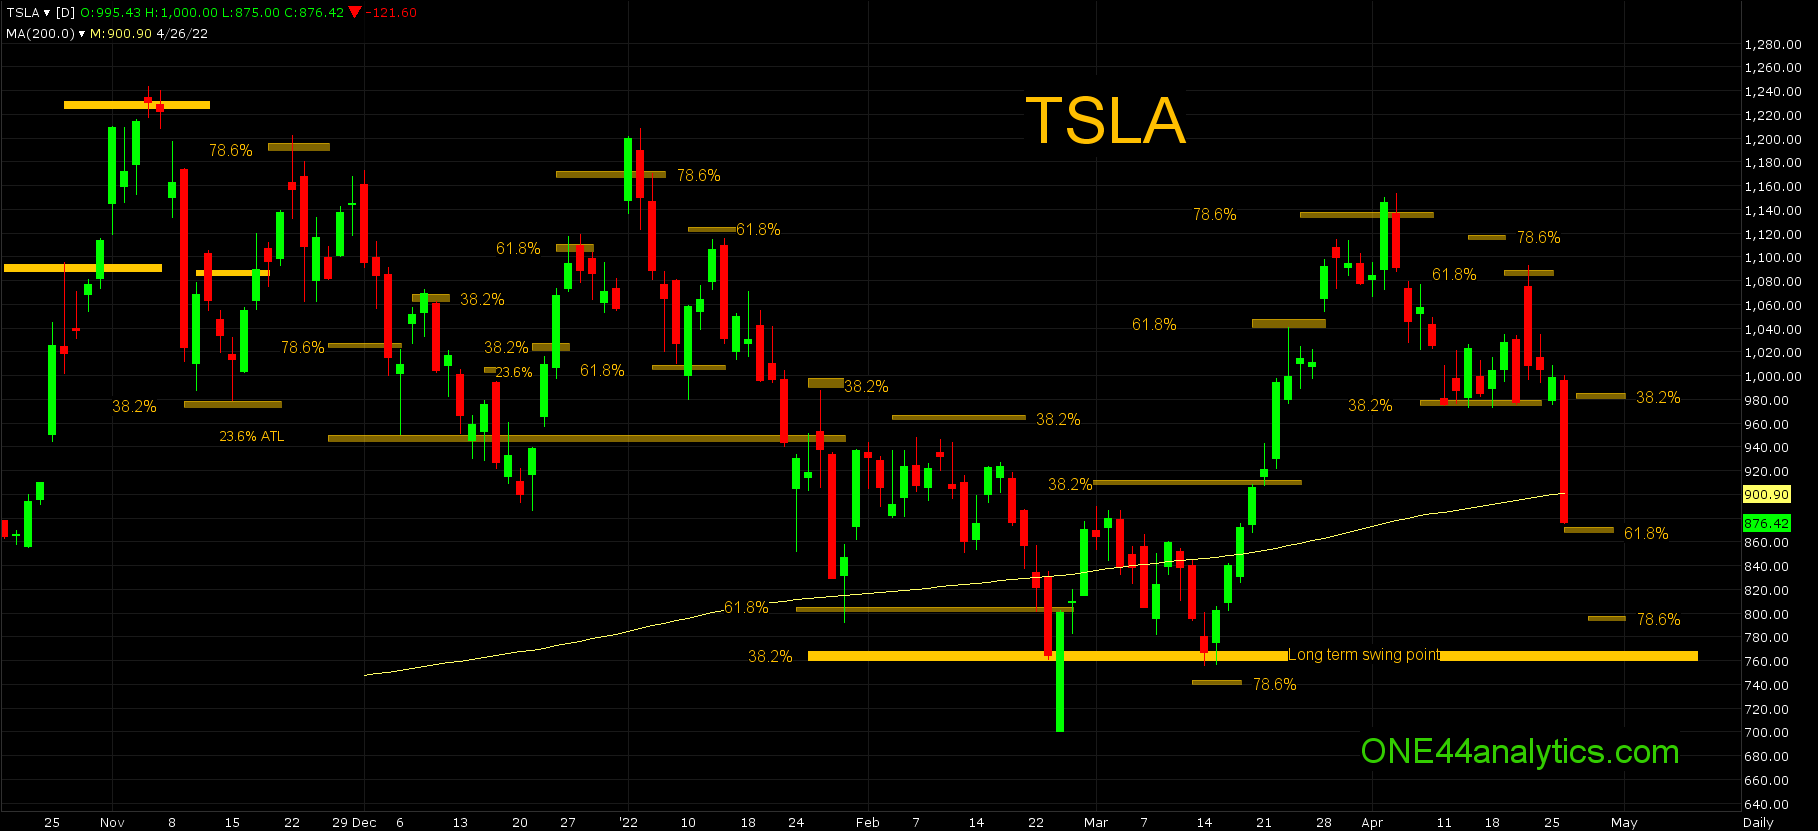
As you can see on the chart below, it sat on the 38.2% level of 980.00 for 5 trading days before going up to 61.8% at 1085.00 and as we said above, A rally from 980.00 that fails to make a new high above 1152.87 would be a negative sign. By failing to make a new high after holding 38.2% the next target on a break below 980.00 would become 61.8% at 871.00 following the ONE44 Fibonacci 38.2% rule. It closed at 876.42 and the aftermarket is trading at 865.00. The ONE44 78.6% rule still tells us the break can take the market down to 78.6% the other way and this is 800.00.
To do damage to the long term trend it would have to take out 768.00, this is 38.2% of the ATH and ATL. With the current break you can watch 38.2% back up to see if the break is going to continue, with today's low this is 981.00 any rally that fails to get above here keeps the short term trend negative.
Sign up for our Free newsletter here.
This is our latest video on using Fibonacci retracements with the ONE44 rules and guidelines. It deals with the Grain market. Even if you do not trade Grains it is worth watching. All the rules and guidelines work in ALL markets. We also have videos for other markets on our YouTube channel.
FULL RISK DISCLOSURE: Futures trading contains substantial risk and is not for every investor. An investor could potentially lose all or more than the initial investment. Commission Rule 4.41(b)(1)(I) hypothetical or simulated performance results have certain inherent limitations. Unlike an actual performance record, simulated results do not represent actual trading. Also, since the trades have not actually been executed, the results may have under- or over-compensated for the impact, if any, of certain market factors, such as lack of liquidity. Simulated trading programs in general are also subject to the fact that they are designed with the benefit of hindsight. No representation is being made that any account will or is likely to achieve profits or losses similar to those shown. Past performance is not necessarily indicative of future results.