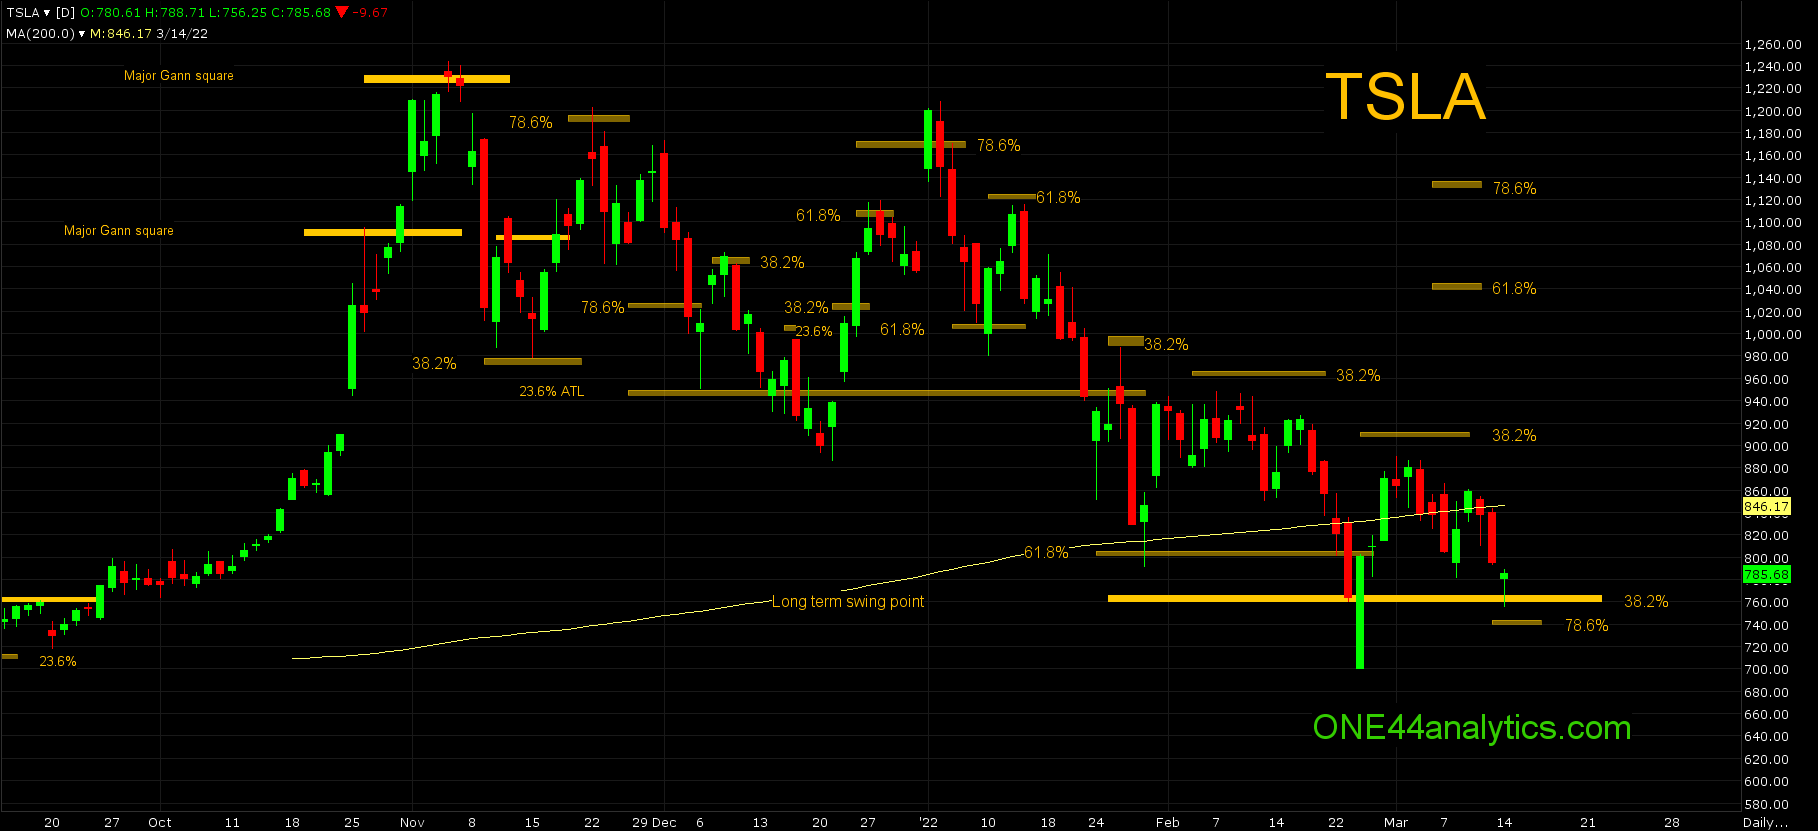
TSLA retesting the long term swing point

Tesla
We left you with this on our last update on 2/23/22,
Going forward,
With the long term swing point (765.00) being just below 61.8% (805.00) and a break from the 38.2% area (960.00) saying it should go for new lows. The best scenario for a move to the upside would be, it makes that new low, hits the long term swing point and then closes back above 805.00. Provided this did happen the long term target would be a new ATH, just as it was when they held the long term swing point back on 3/5/21. Short term, a rally from there should take it to 61.8% back up since the current break is reacting from the 38.2% area. With the current low this is 1070.00. As always we will watch all the retracements on any move higher to see just how strong, or weak the market is and 38.2% is always the most important.
A failure to hold the long term swing point should send this market to 61.8% at 471.00.
The low on 2/24/22 traded well below the 765.00 long term swing point, however it never closed below it and a $130.00 rally followed. The top of that move fell short of 38.2% (909.00) back to the ATH on 3/1/22, keeping the short term trend negative. The break has now hit the long term swing point again and we are looking for another rally to begin.
Upside targets,
Being the long term swing point is 38.2% of the ATH and ATL, we know the long term target is new highs for the move. As always we will watch all the retracements on every move to see just how strong, or weak the market is regardless of the long term target.
ONE44 38.2% rule
38.2% is the single most important retracement and is the level we use for the "Golden Rule". This rule being, " any market that is going to keep its current trend must hold 38.2%". As long as it does the trend will continue and it should make new highs/lows from that retracement.
Short term the next rally from 765.00 should take it to 61.8% at 1040.00 since the last high was just below 38.2%. We will still watch 38.2% at 909.00, because it is this level that needs to be taken out to get the short term positive and in sync with the long term trend.
On a failure to hold the long term swing point,that also closes below 78.6% at 742.00, look for 61.8% of the same move at 471.00.
Sign up for our Free newsletter here.
FULL RISK DISCLOSURE: Futures trading contains substantial risk and is not for every investor. An investor could potentially lose all or more than the initial investment. Commission Rule 4.41(b)(1)(I) hypothetical or simulated performance results have certain inherent limitations. Unlike an actual performance record, simulated results do not represent actual trading. Also, since the trades have not actually been executed, the results may have under- or over-compensated for the impact, if any, of certain market factors, such as lack of liquidity. Simulated trading programs in general are also subject to the fact that they are designed with the benefit of hindsight. No representation is being made that any account will or is likely to achieve profits or losses similar to those shown. Past performance is not necessarily indicative of future results.