U.S. Dollar has hit the long term Fibonacci swing point
ONE44 Analytics where the analysis is concise and to the point
Our goal is to not only give you actionable information, but to help you understand why we think this is happening based on pure price analysis with Fibonacci retracements, that we believe are the underlying structure of all markets and Gann squares.
For the ONE44 Fibonacci rules and guidelines to help with this article, go here.
Charts are courtesy of Barchart.com
U.S. Dollar
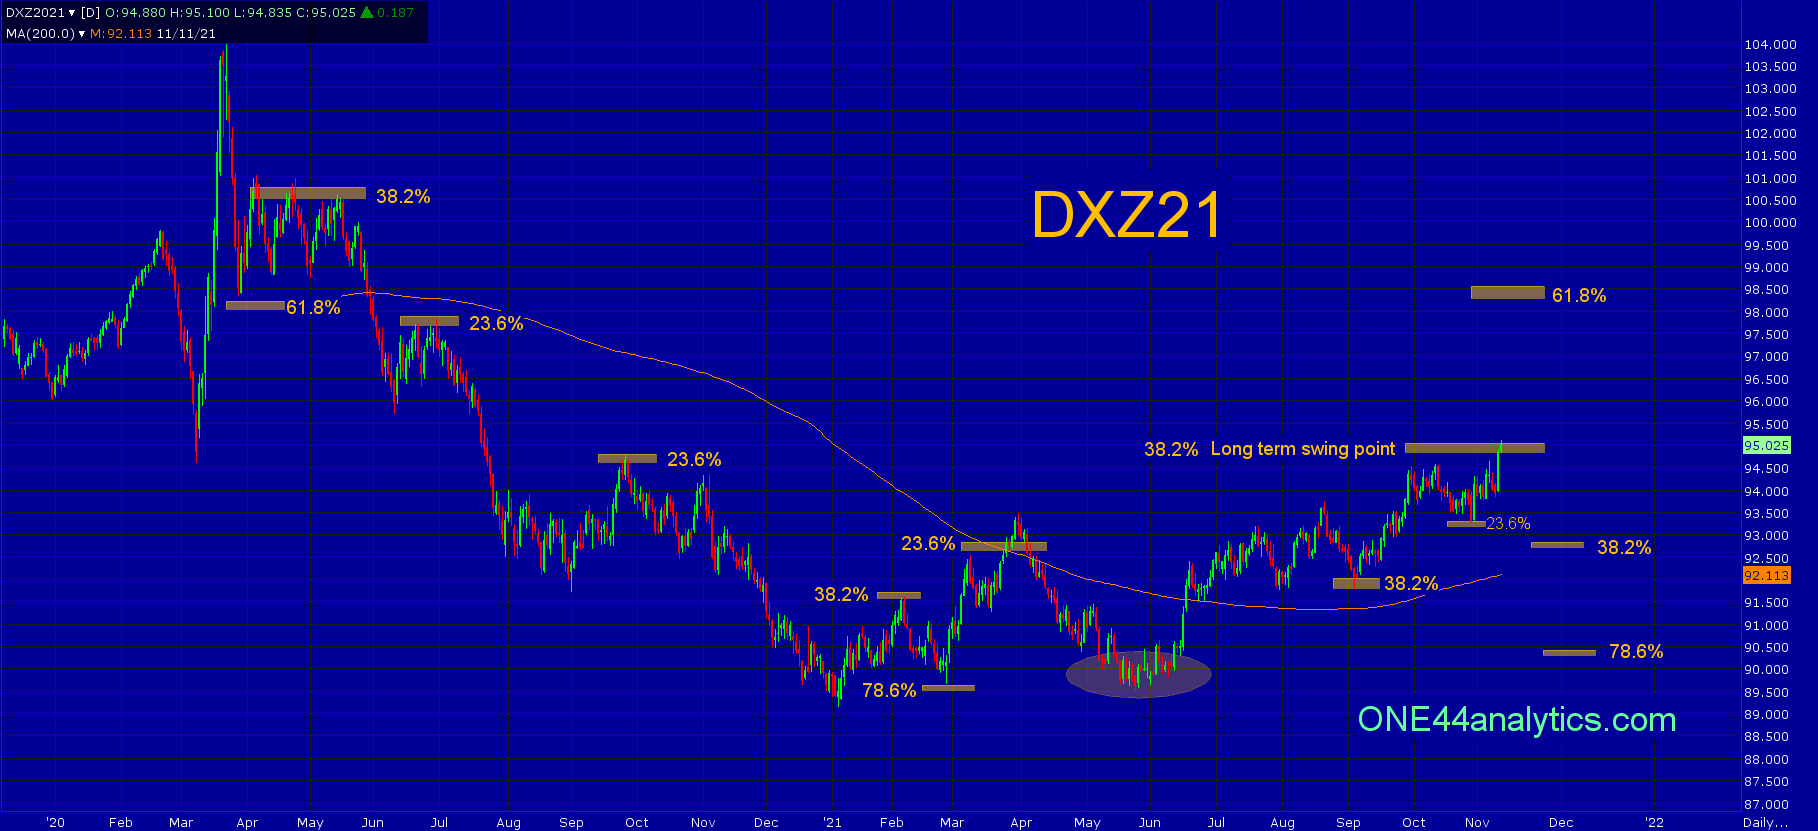
The short term trend turned positive back in May when it failed to make a new low after coming off of 23.6% in March. The target from the failure to make the new low was 38.2% (94.90) of the same move and this is where it is today.
The first setback on the rally from the May low held 38.2% on 7/30/21 and as the 38.2% rule states, it should go for new highs to keep the short term trend positive. After the new high from there, it retreated again to 38.2% on 9/3/21. This also led to a new high for the move as it should, keeping the short term trend positive. The next rally fell just short of the long term swing point of 94.90, this is 38.2% of this year's low and last year's high. The break from there was only able to get back to 23.6% of the year's low, this happened on 10/28/21. This rally has taken it to the 94.90 long term swing point.
As for now,
The retracements below show that the market is getting stronger by holding tighter levels, however this is the long term swing point they are at. With this being 38.2% we have to follow the 38.2% rule and that can send it down to new lows longer term and a failure to turn at this level should send it to 61.8% of the same move.
On a break from here we would look for new lows, however as always we will watch all the retracements on any setback to see just how weak, or strong the market is regardless of the long term target. Any break that can only get back to 38.2% (92.80) of the current rally will keep the short term trend positive and you can look for new highs for the move.
Failing to turn lower at 94.90 and with a couple closes above it, the long term trend turns positive and we will look for 61.8% at 98.30.
Sign up for our Free newsletter here.
FULL RISK DISCLOSURE: Futures trading contains substantial risk and is not for every investor. An investor could potentially lose all or more than the initial investment. Commission Rule 4.41(b)(1)(I) hypothetical or simulated performance results have certain inherent limitations. Unlike an actual performance record, simulated results do not represent actual trading. Also, since the trades have not actually been executed, the results may have under- or over-compensated for the impact, if any, of certain market factors, such as lack of liquidity. Simulated trading programs in general are also subject to the fact that they are designed with the benefit of hindsight. No representation is being made that any account will or is likely to achieve profits or losses similar to those shown. Past performance is not necessarily indicative of future results.