Fibonacci Chart of the Week UNH

ONE44 Analytics where the analysis is concise and to the point
In our opinion we believe that the Fibonacci retracements are the underlying structure of all markets and in these weekly examples we give educational and actionable information.
As usual we will go back to show you where it has come from and what key levels they held first, then bring you up to date.
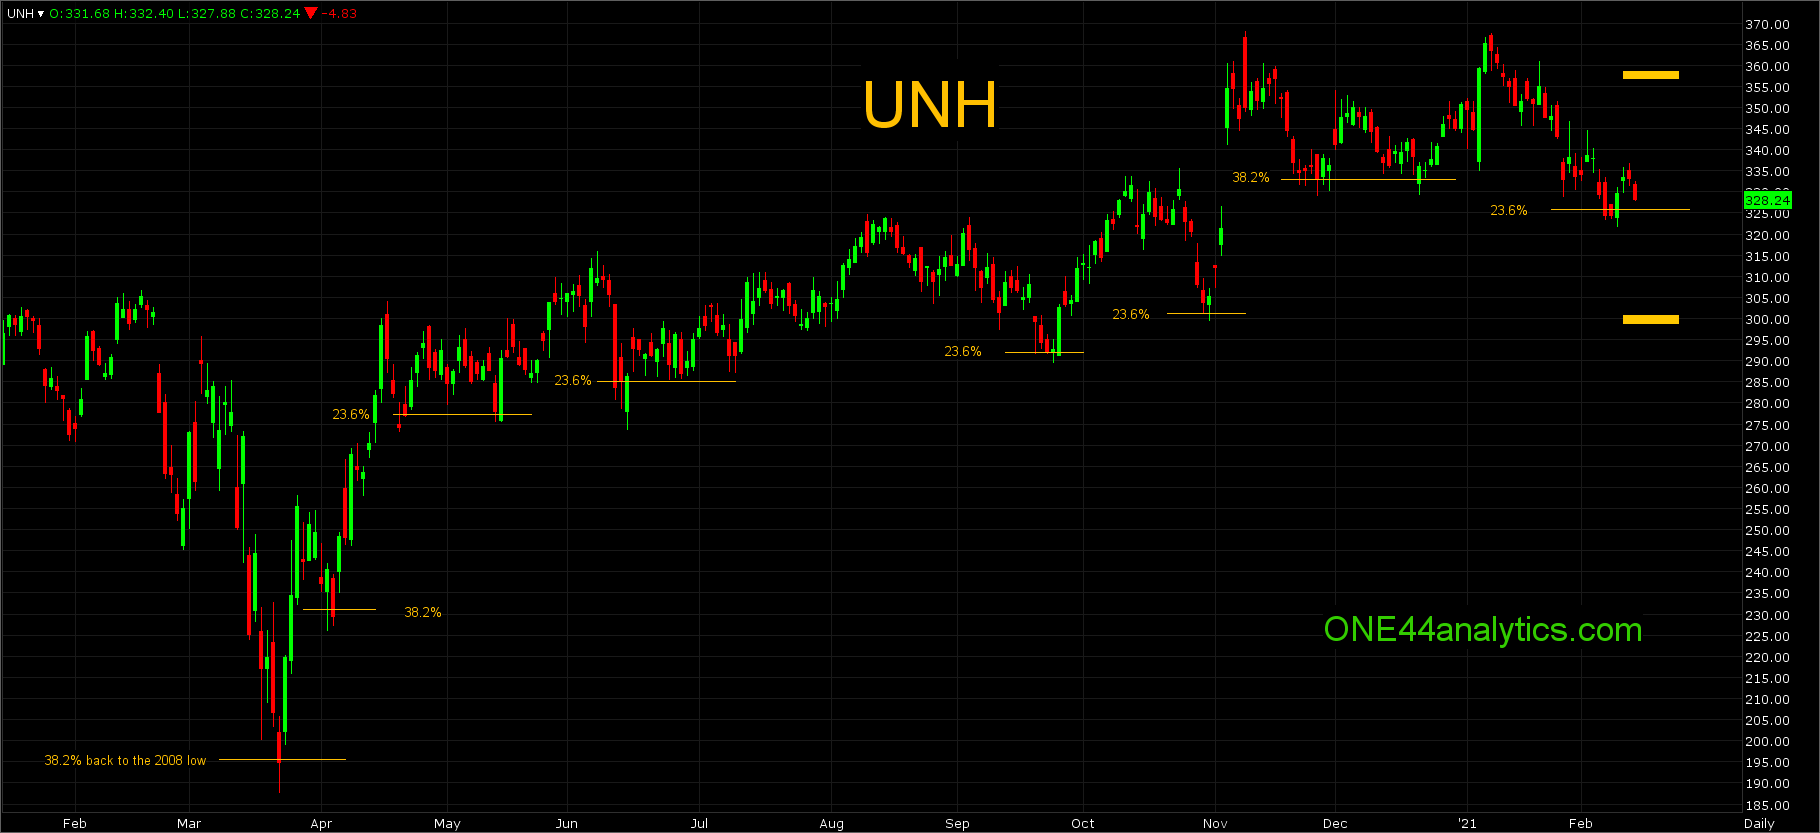
This example is for UnitedHealth Group/ UNH
Educational
We will start with the Pandemic panic low on 3/23/20. The interesting thing about this is that it is 38.2% (195.00) back to the 2008 panic low and this shows just how important it is to know all of the extreme retracements. Based on the ONE44 Fibonacci rules and Guidelines, we know that a rally from 38.2% should send them to new highs. With such extreme retracements the target of new highs (above 306.71) will be a long term target and we will watch all the retracements on any rally to see just how strong , or weak the market is.
The first setback after the 3/23/20 low was on 4/2/20, this low traded below 38.2% at 231.00 and even had one close below it before going on to new highs for that setback. Those that have followed previous updates know that they can trade below a level and even have a close below it, as long as it is right back above it the next day. There are even times where two closes are acceptable, but they should never last more than that and they should move away quickly once back above. The rally from there almost took it to new all-time highs.
The setback from 304.00 went right back to 23.6% of the rally from the 3/23/20 low, this was 277.00, again one close below, but right back above it. It also hit this level again 5/13/20 before going on to a new all-time high.
The break from the new ATH (315.84) again had one close below 23.6% at 285.00 on 6/11/20, they even traded well below it, but closed back above, keeping the idea of new highs intact.
They did go on to a new ATH at 324.57 and the setback from there on 9/23/20 once again held 23.6% (291.80) back to the 3/23/20 low and again, on to a new ATH at 335.65. The break from there on 10/29/20 took it to 23.6% at 301.00. The move up from there exploded to a new ATH at 367.95 in six days. Everyone of the setbacks that stand out on this run up has held a key retracement back to the 3/23/20 low. We know based on the ONE44 Fibonacci rules and guidelines that a powerful market will only retrace 23.6% and should always go on to new highs as you have seen in this example and that it would have to take out 38.2% to do damage to the current trend.
When a market is extremely strong it won't even be able to retrace back to the extreme low and that is when you have to watch the retracements from lows that are higher up that stand out. In this case the low made on 6/15/20 was the bottom of the biggest setback on the rally from the 3/23/20 low and the one to use. By using this low and the ATH, we see the lows that happened on 11/20/20 and then again on 12/21/20 held 38.2% back at 333.00.
Actionable
This now brings us to the actionable information. With the ATH and the 3/23/20 low they are right on 23.6% of that move at 325.50. As long as they continue to close above this level you can look for a new ATH, or at least 78.6% back up to the ATH at 357.00. As always we will watch all the retracements on any rally from 325.50 and if it can not get above 38.2% of the break from the ATH at 340.00 it would be a negative sign. On a failure to hold 325.50 look for 300.00, this is 38.2% back to the 3/23/20 low and the long term swing point.
Our goal is to not only give you actionable information, but to help you understand why we think this is happening based on pure price analysis with Fibonacci retracements and Gann squares.
Sign up for our Free newsletter here.
This is our latest video in an ongoing series of how to use the Fibonacci retracements. Even if you do not trade the market covered the rules and guidelines are the same, as we believe the Fibonacci retracements are the underlying structure of all markets. In this video for AMD the actionable information has already produced a 10% move in 9 trading day's.
https://www.youtube.com/watch?v=gSISbkEtQj0&t=143s&ab_channel=ONE44Analytics