Viewer request A6Z21
ONE44 Analytics where the analysis is concise and to the point
Our goal is to not only give you actionable information, but to help you understand why we think this is happening based on pure price analysis with Fibonacci retracements, that we believe are the underlying structure of all markets and Gann squares.
Viewer request
This article will go over the Australian Dollars future contract (A6Z21)
Here is a quick set of guidelines for the Fibonacci retracements to help with this article. You can find all the rules/guidelines and examples on any deviations from these four basic rules on our website.
1) The Golden rule, any market that is going to continue the current trend must hold 38.2% and a new high/low should follow.
2) Markets that are extremely strong/weak will only go 23.6% and a new high/low should follow. Typically a runaway market.
3) The 61.8% rule is, any market that holds 61.8% should go 61.8% of where it just came from. Usual happens when a market is directionless, or in a consolidation period.
4) The 78.6% rule is, any market that holds 78.6% should go 78.6% of where it just came from. This is also where a lot of Bull markets end and start.
Charts are courtesy of Barchart.com
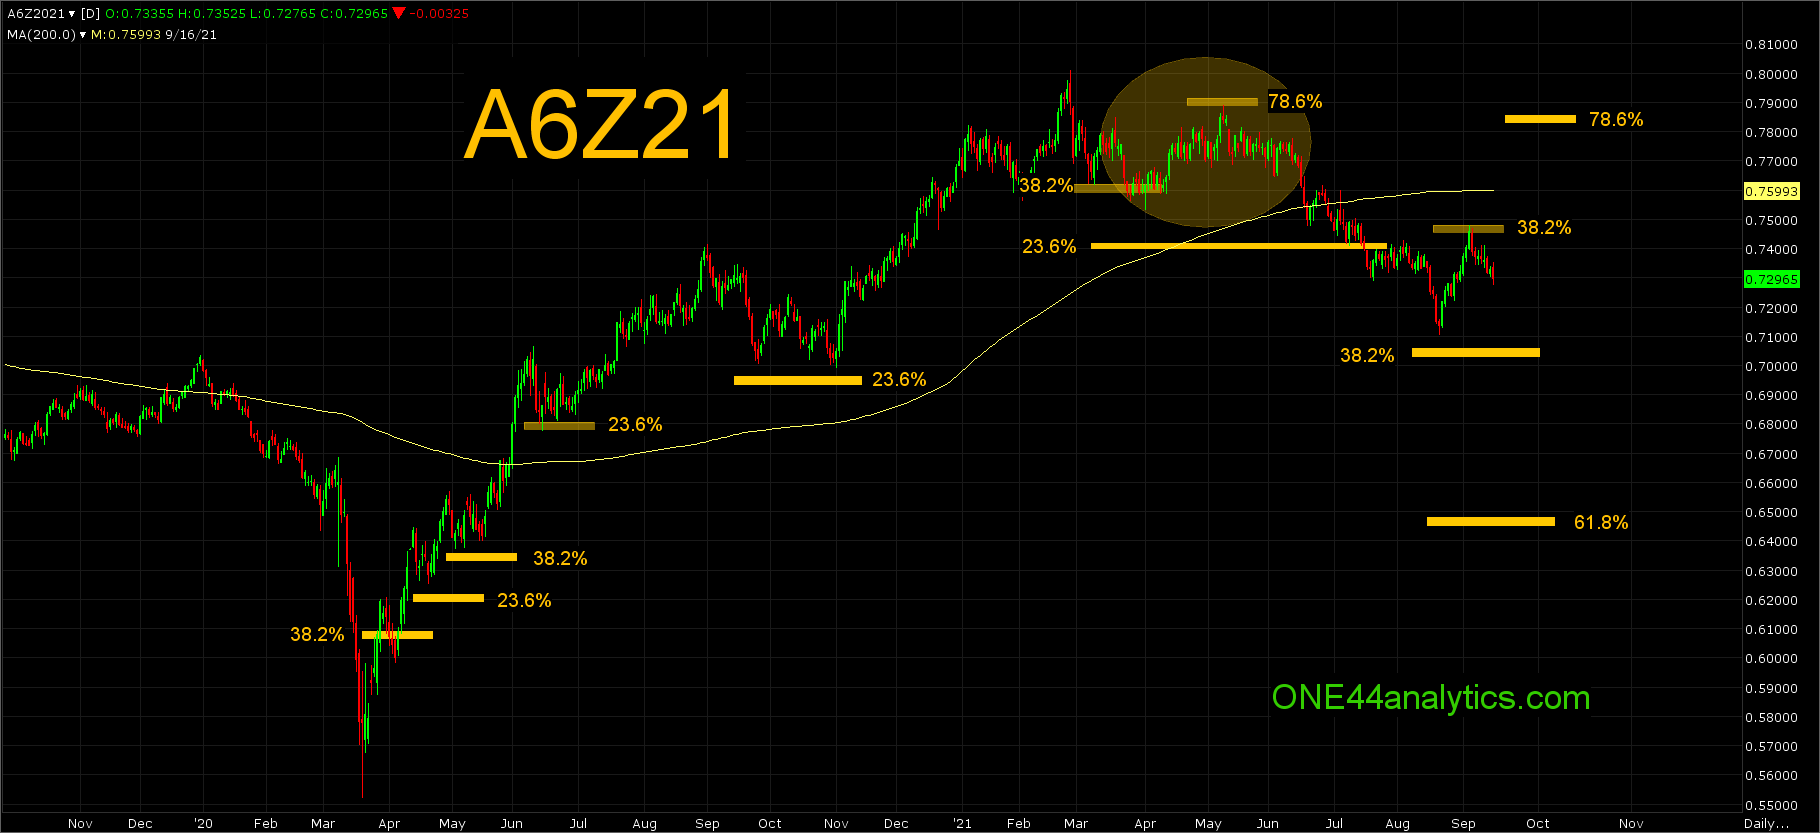
We will start with the rally after the 3/19/20 low. When 38.2% of the last move down at 0.6067 was taken out it told us there is a good chance of a trend change and that we should start to watch the retracements below to verify this. The first setback could not even get back to 38.2% of the rally at that point. After making new highs, the next setback on 4/21/20 held above 23.6% to the low. Using the 23.6% rule, it fits both, an extremely strong market and a runaway market. So much so that we had to start retracing to higher lows to get tighter support.
The low on 5/4/20 held above 38.2% of high on 4/30/20 and the 4/3/20 low. The next setback on 6/15/20 held 23.6% back to the 4/3/20 low and it was also 38.2% back to the 5/4/20 low. The next big setback came after the high on 9/1/20 and it held above 23.6% back to the 3/19/20 low, keeping the trend extremely strong and new highs followed.
The rally from the 11/2/20 low took it to the high for this year on 2/25/21. The break from that high held well above 23.6% back to the 3/19/20 low, however it did hit 38.2% back to the 11/2/20 low and this is where things start to change.
Following the 38.2% rule we know in order to keep the current trend intact it should make new highs and any failure to do so, should send it back to 61.8% of the same move. There is also the 78.6% rule that is coming into play, as quoted above "This is also where a lot of Bull markets end and start." The break from there took it below 23.6% to the 3/19/20 low for the first time. It did hold above 38.2% of that same move, however the rally stopped at 38.2% of the current break, this was on 9/3/21.
Currently
The short term says to look for new lows after hitting 38.2% above. A longer term target to look for would be 61.8% of the 3/19/20 low, this is 0.6480.
The long term trend is still positive until they take out 38.2% of the 3/19/20 low, this is 0.7060. Holding it should send them to new highs for the year, however as we always say, watch all the retracements on every move to see just how weak, or strong the market is. Provided they did get down to this area, any rally that does not get above 38.2% of the current break will keep the short term trend negative regardless of what retracement was hit below.
You can go back to the 1/ 26/18 high and watch all the same rules apply to the short side of the market going into the 3/19/20 low.
We are looking for your input, if there is a stock, or futures market you would like to see us do Fibonacci analysis on, email the ticker symbol to [email protected]
We will update these on the ONE44 website along with posting them on Barchart.com.
Sign up for our Free newsletter here.
FULL RISK DISCLOSURE: Futures trading contains substantial risk and is not for every investor. An investor could potentially lose all or more than the initial investment. Commission Rule 4.41(b)(1)(I) hypothetical or simulated performance results have certain inherent limitations. Unlike an actual performance record, simulated results do not represent actual trading. Also, since the trades have not actually been executed, the results may have under- or over-compensated for the impact, if any, of certain market factors, such as lack of liquidity. Simulated trading programs in general are also subject to the fact that they are designed with the benefit of hindsight. No representation is being made that any account will or is likely to achieve profits or losses similar to those shown. Past performance is not necessarily indicative of future results.