Weekly Grain/Livestock Update 2/13/25
We hope you have watched our latest video,
ONE44 Analytics, Fibonacci retracements, How the Grains put in their Bottom.
ONE44 Analytics sends an email to every Premium Member when the Weekly update is done on Thursdays, if you do not receive one, please check your spam folder, or make sure you are signed up for the emails in your ONE44 account settings.
Being this is a weekly update we give all the key levels to watch for the week using Fibonacci retracements and Major Gann squares. We set up scenarios to look for when a level holds, or fails based on these methods, so it is very important to know for yourself how to use them following the ONE44 rules and guidelines. The best way to get a better understanding of these methods is to read all the posts (even if not on Grains) and watch our YouTube videos, as we explain why we think what we think based on the rules and guidelines. It is also important to view all the charts, as they have the key levels marked on them, if there are extended moves.
Thank You to all the new subscribers!
To all our Subscribers, when you are logged in to our website you will get all of the content in every post, so it may look like every Member/Non Member is getting the same thing. Please be assured that what you are paying for as a Premium Member of "Grains Weekly" is only accessible by you and is not posted anywhere else for free. This can be proven by logging out and trying to get the full article that has a yellow star with it. One exception is we will occasionally post articles on Barchart.com with excerpts from our website and Videos to draw people to the website.
Soybeans
| Trend | Swing Point | Target | |
|---|---|---|---|
| Long Term | 1095.00 | 940.00 | |
| Intermediate Term | 1026.00 | 1095.00 | |
| Short Term | 1026.00 | 1095.00 | |
| As of: 2/13/2025, 1:52:05 PM | |||
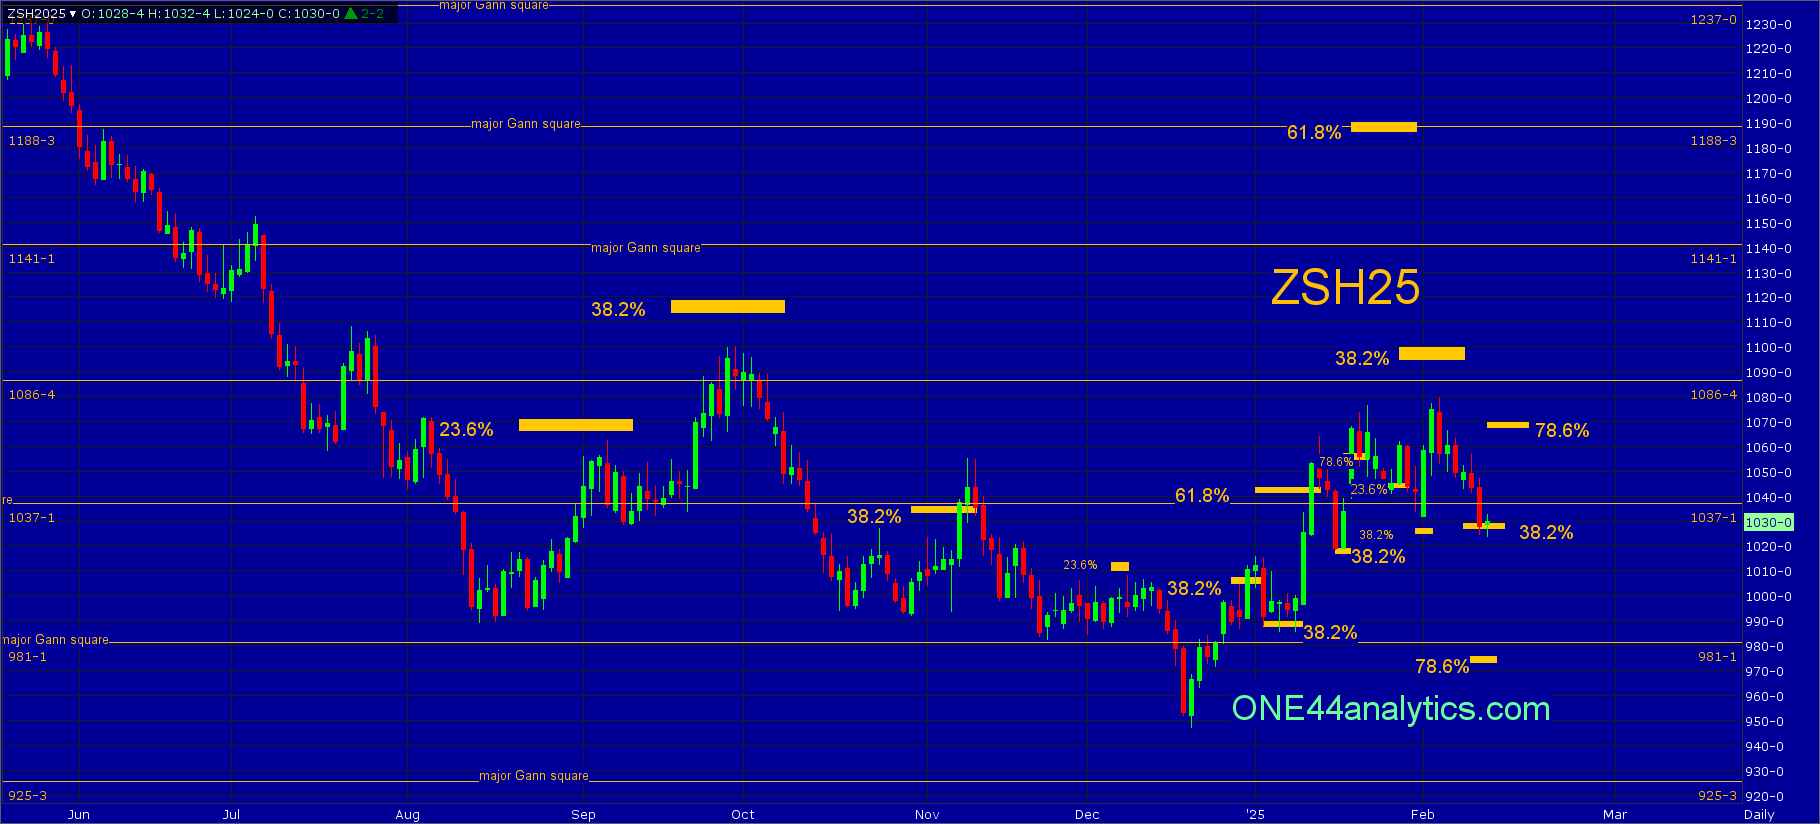
March
From last week,
It had two minor closes below1045.00, but held well above the short term target of 1027.00 (38.2%) keeping the short term trend positive. It still needs to take out 38.2% back to the contract high at 1095.00 to turn the long term trend positive, this level will be key for the next week.
Use 1095.00 as the swing point for the week.
Below it, the short term target is 38.2% back to the 12/19/24 low at 1029.00, holding this keeps the short term trend positive and a new high can quickly follow. The long....
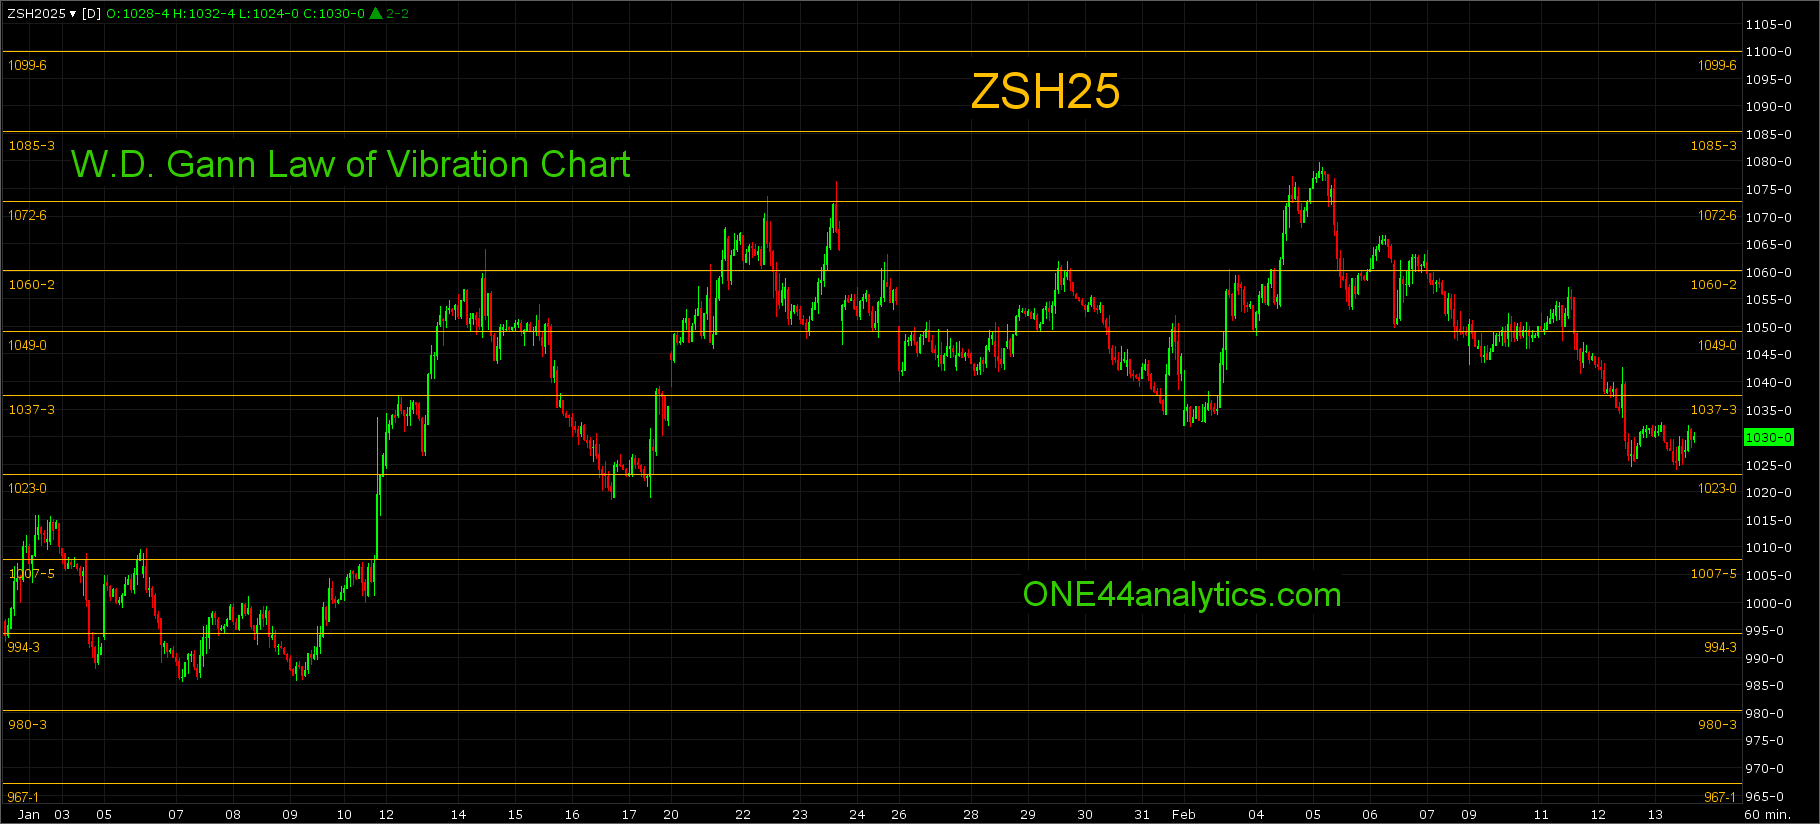
The setback this week hit the short term target of 38.2% back to the 12/19/24 low at 1029.00, this will be the key level for the next week. Holding it is a strong sign and it could go for a new high just as it did after holding 38.2% on 1/7/25 and 1/16/25. We will also be watching the 78.6% level back to the 2/5/25 high, as a failure to make a new high in the area of 78.6% retracement can cause a quick setback per the ONE44 78.6% rule.
Use 1029.00 as the swing point for the week.
Above it, the short term target is 78.6% back to the 2/5/25 high at 1068.00. The longer term target is the long term swing point at 1095.00, above it turns the long term trend positive, You will still have to watch for a trade up to, or though 1095.00 and a close back below the 1086.50 major Gann square, as this can cause a quick setback. The long term target is 61.8% back to the contract high at 1188.25, this is also a major Gann square.
Below it, turns the short term trend negative and the target area is the 981.00 major Gann square and 78.6% at 976.00.
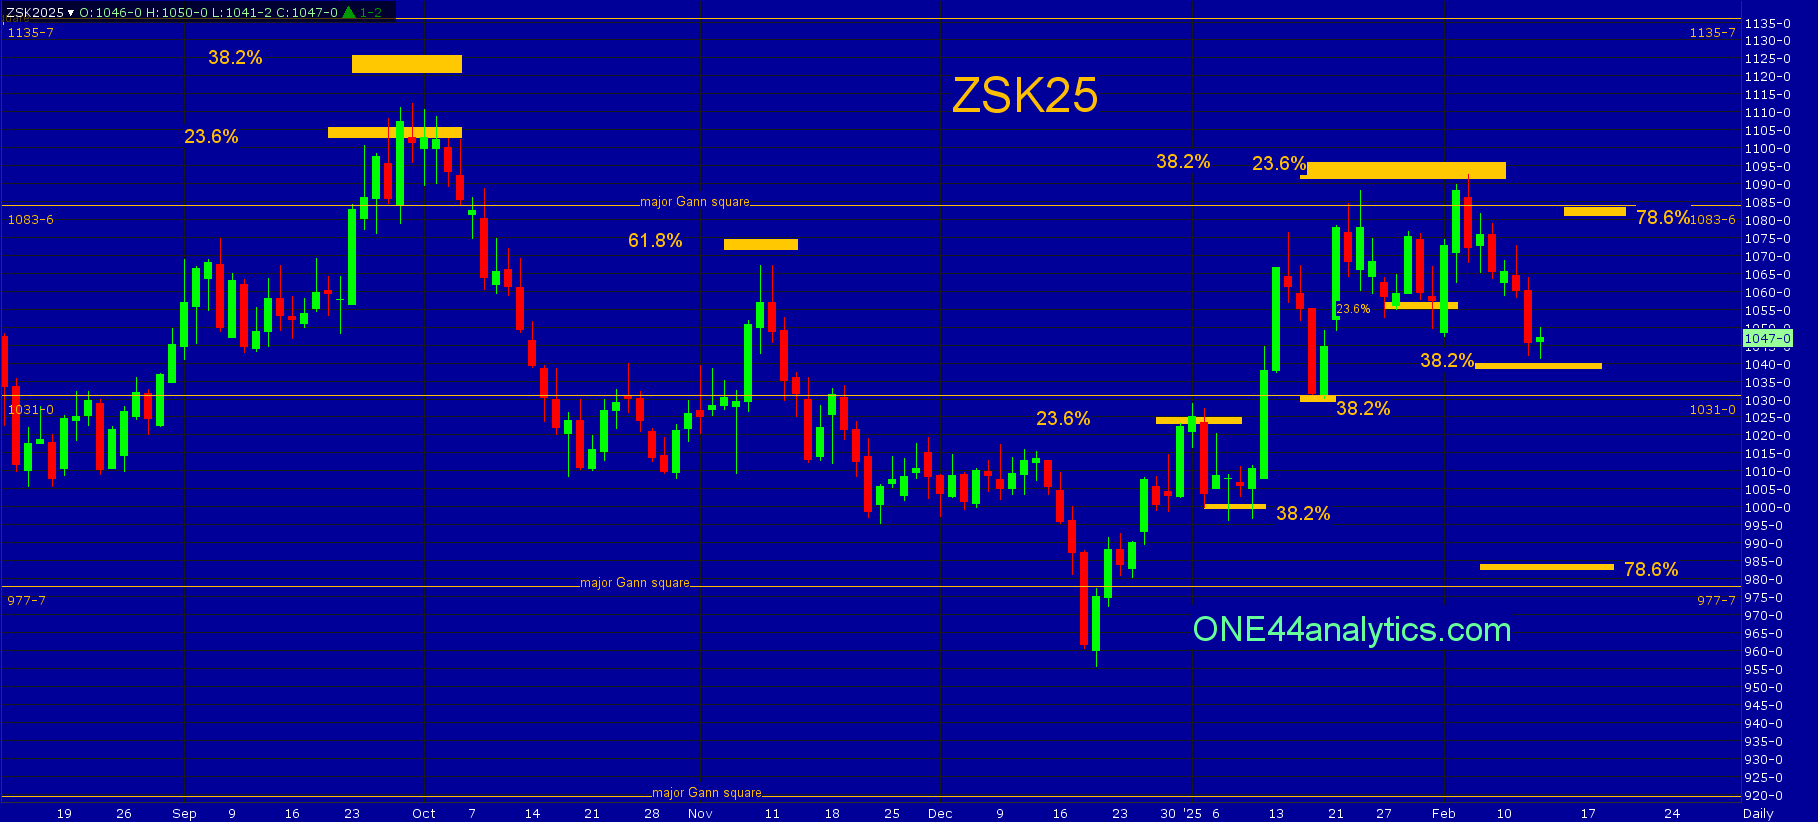
May
From last week,
It did trade below the 1057.00 swing point for the week, but never closed below it. The rally from it hit the long term combination of retracements at 1092.00 and then closed below the 1083.75 major Gann square. We will see if this area sends the market sharply lower. We will also watch all of the retracements on any setback to see just how weak, or strong the market is. The key level for next week will be the combination retracement level at 1092.00.
Use 1092.00 as the swing point for the week.
Below it, with the combination of longer term retracements at 1092.00 a quick selloff is still possible, provided there is, the long term target area is 78.6% at 984.50 and the 977.75 major Gann square. Any setback that holds 38.2% at 1040.00 keeps the short term trend positive and a new high can quickly follow.
The setback after hitting the combination level of 1092.00 (23.6% & 38.2%) has had a 50 cent setback so far and a penny short of 38.2% at 1040.00, this is the level that needs to hold to keep the short term trend positive, it will be the key level for the next week.
Use 1040.00 as the swing point for the week.
Above it, if this is all it can setback after hitting key longer term retracements above it is a very strong sign and a new high can follow. We will also be watching the 78.6% level back to the 2/5/25 high at 1081.00, a failure to make a new high in this area can send the market quickly lower (ONE44 78.6% rule). When and if it clears the 1092.00 area the long term target area is 61.8% back to the contract high at 1174.00 and the 1185.50 major Gann square. Before then is a major Gann square at 1135.75 to look for resistance and then use as the swing point when closed above.
Below it, you still have to watch for a trade down to the 1031.00 major Gann square and a close back above 1040.00 as this can cause a quick rally back to the high. Below 1040.00 turns the short term trend negative and the target area is 78.6% at 984.50 and the 977.75 major Gann square.
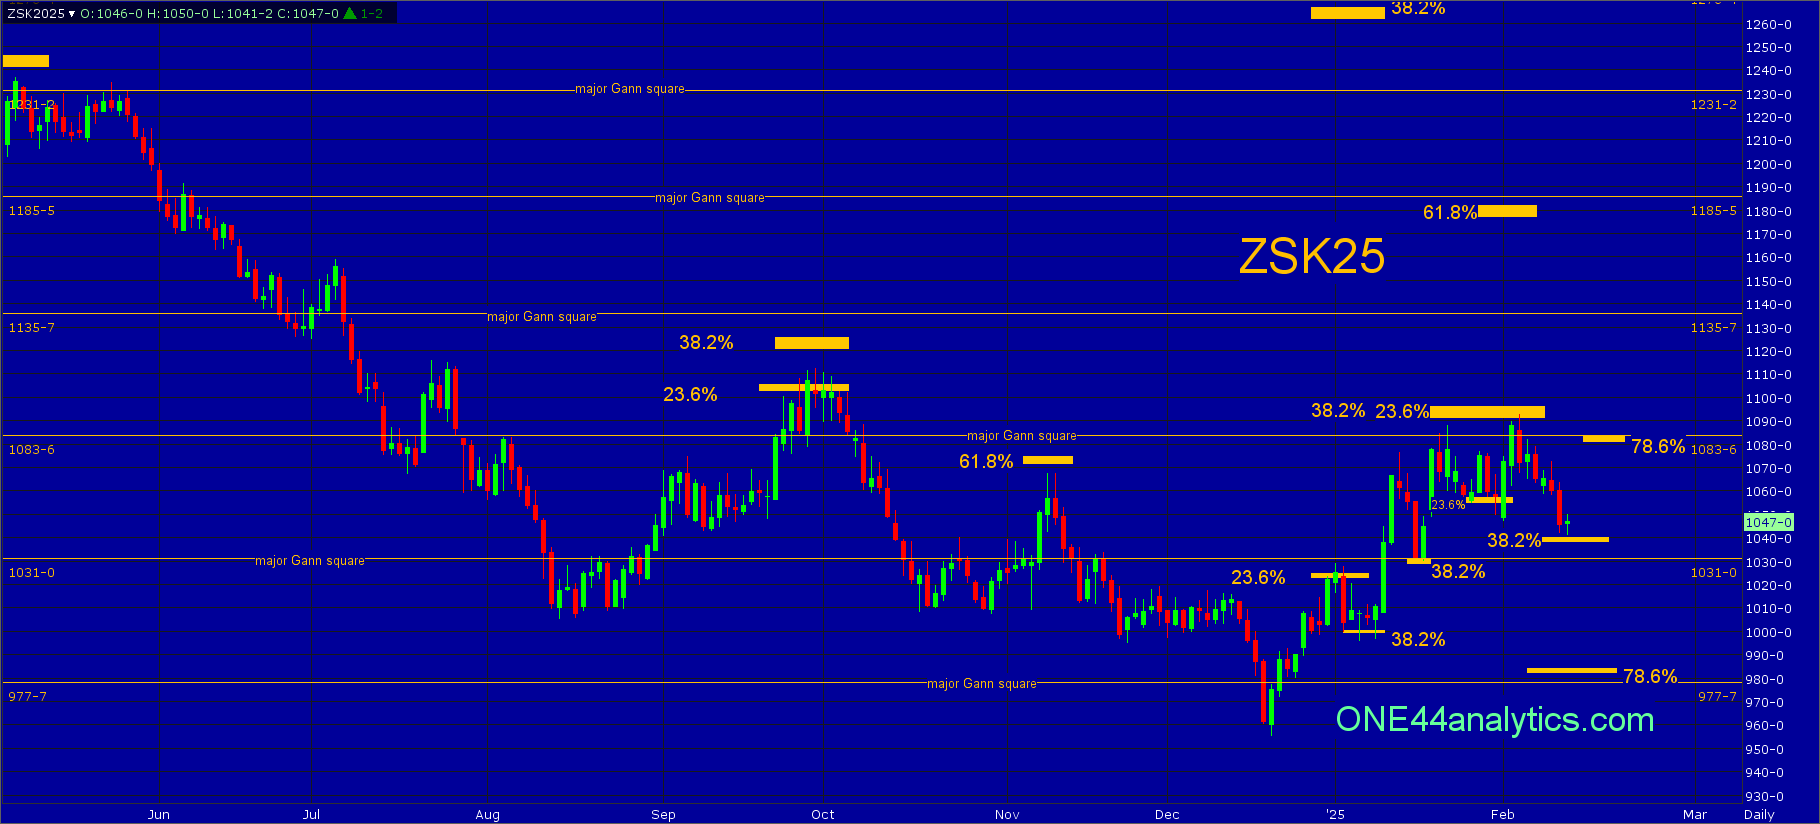
Law of Vibration chart for short term support and resistance
Soybean Meal
| Trend | Swing Point | Target | |
|---|---|---|---|
| Long Term | 335.00 | 290.00 | |
| Intermediate Term | 315.00 | 290.00 | |
| Short Term | 303.00 | 277.00 | |
| As of: 2/13/2025, 1:56:39 PM | |||
This will be the last update for March.
From last week,
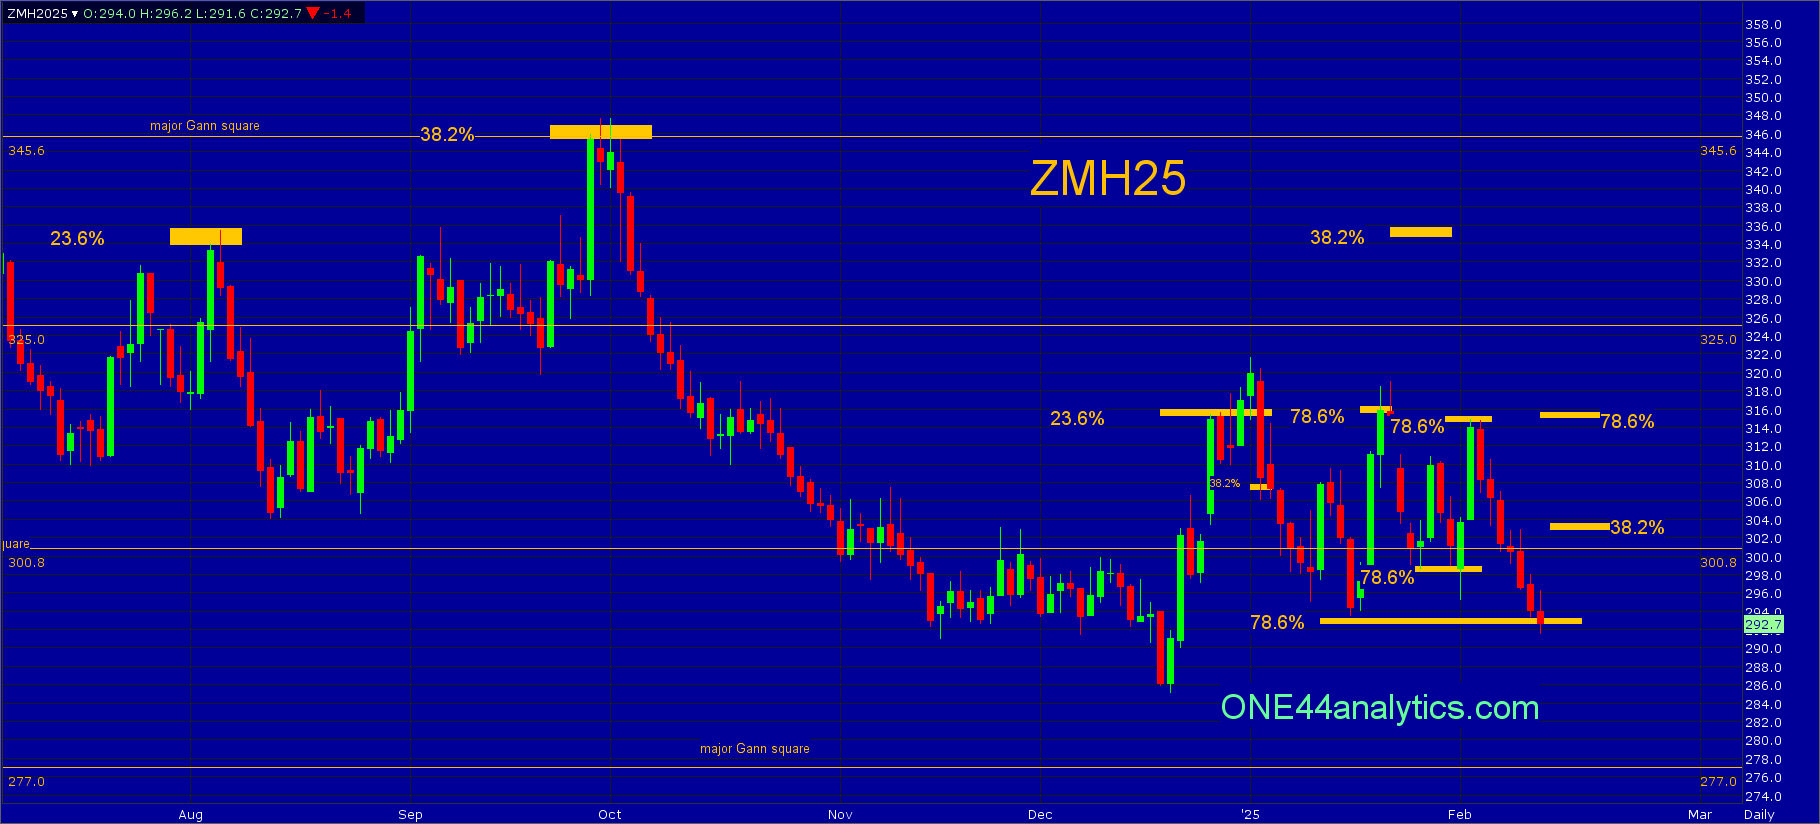
The rally from 299.00 (78.6%) went right to 78.6% the other way at 314.50 per the ONE44 78.6% rule. It still looks like it is building a nice base for another run higher in the longer term. We will be looking for the long term swing point to start. The 300.80 major Gann square will be key for the next week.
Use 300.80 as the swing point for the week.
Below it, the short term target is 78.6% of the 12/19/24 low and 1/2/25 high at 293.20. The long....
The trade below the 300.80 major Gann square and swing point for the week has hit the short term target of 78.6% at 293.20, this will be the key level for the next week.
Use 293.20 as the swing point for the week.
Above it, the target is 78.6% the other way at 315.00 per the ONE44 78.6% rule. Any rally that can't get above 38.2% at 303.00 is a negative sign and a new low can follow.
Below it, there are only major Gann squares to look for support and then use as the swing point when closed below, the next one is 277.00.
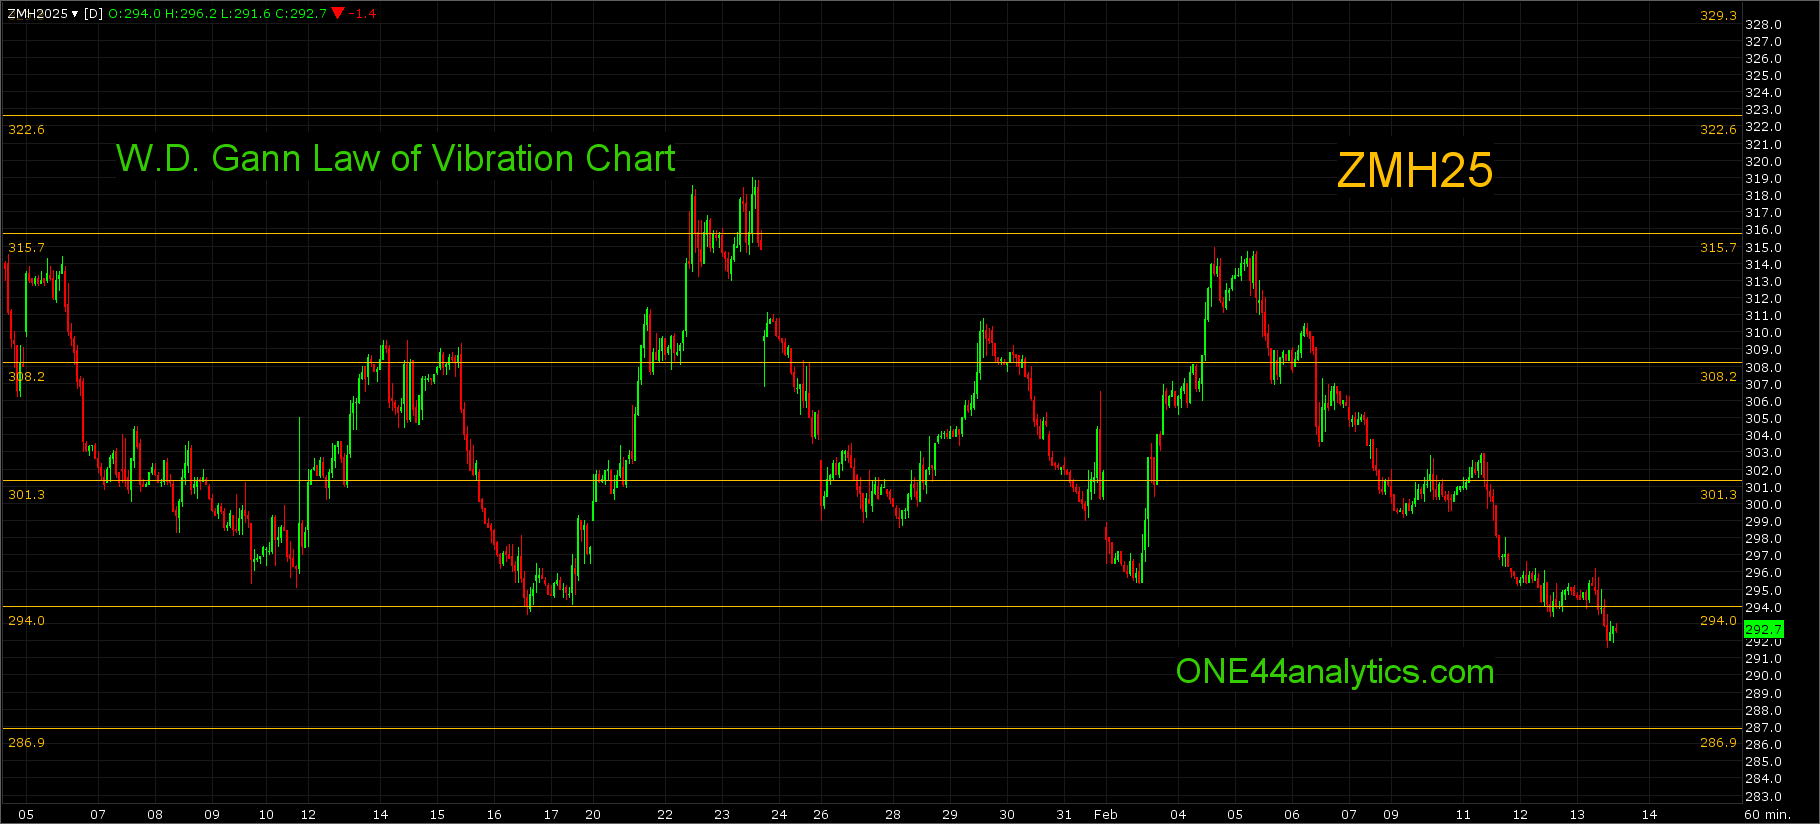
Law of Vibration chart for short term support and resistance
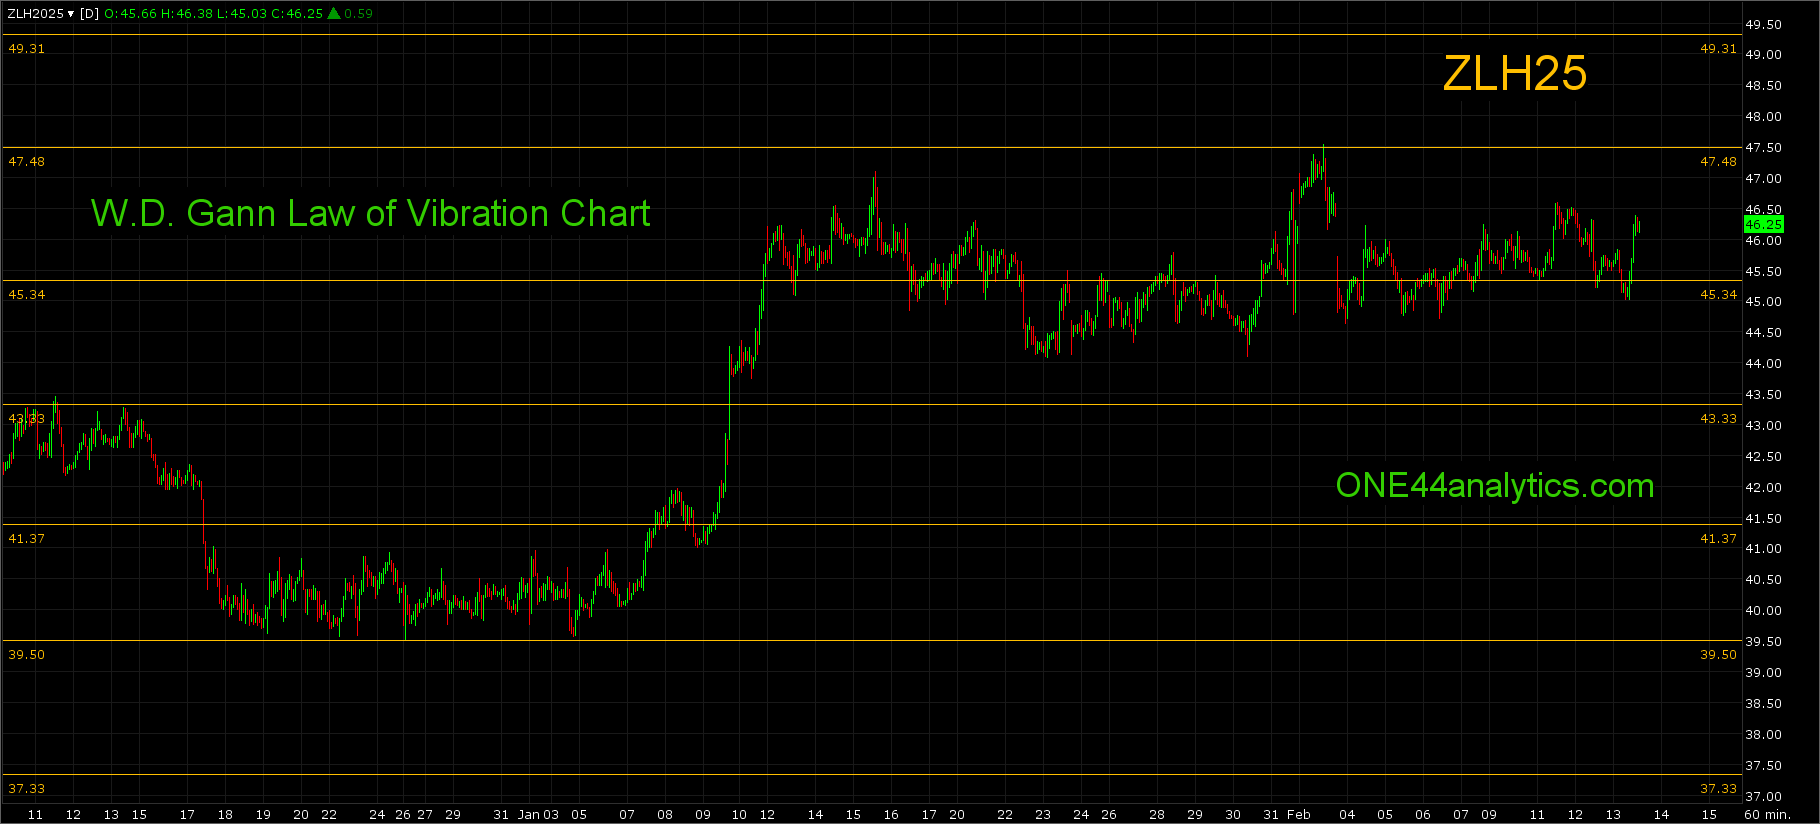
Soybean Oil
| Trend | Swing Point | Target | |
|---|---|---|---|
| Long Term | 50.50 | 39.40 | |
| Intermediate Term | 46.50 | 39.52 | |
| Short Term | 44.20 | 47.50 | |
| As of: 2/13/2025, 1:59:49 PM | |||
This will be the last update for March.
From last week,
The rally from the 44.25 (38.2%) swing point for the week hit the 47.54 major Gann square and 78.6% retracement (high for the week was 47.54). The setback from it is just short of the new 38.2% level at 44.50, this will be the key level for next week.
Use 44.50 as the swing point for the week.
This week held above the 44.50 (38.2%) swing point for the week in a small range. With no new high, or low all the levels remain the same for this week.
Use 44.50 as the swing point for the week again.
Above it, being a 38.2% retracement, holding it keeps the short term trend positive and a new high is possible. The long term target is the 51.15 major Gann square and 61.8% back to the contract high at 51.85.
Below it, turns the short term trend negative and since 47.54 was a 78.6% retracement we will look for 78.6% the other way at 41.20 per the ONE44 78.6% rule.
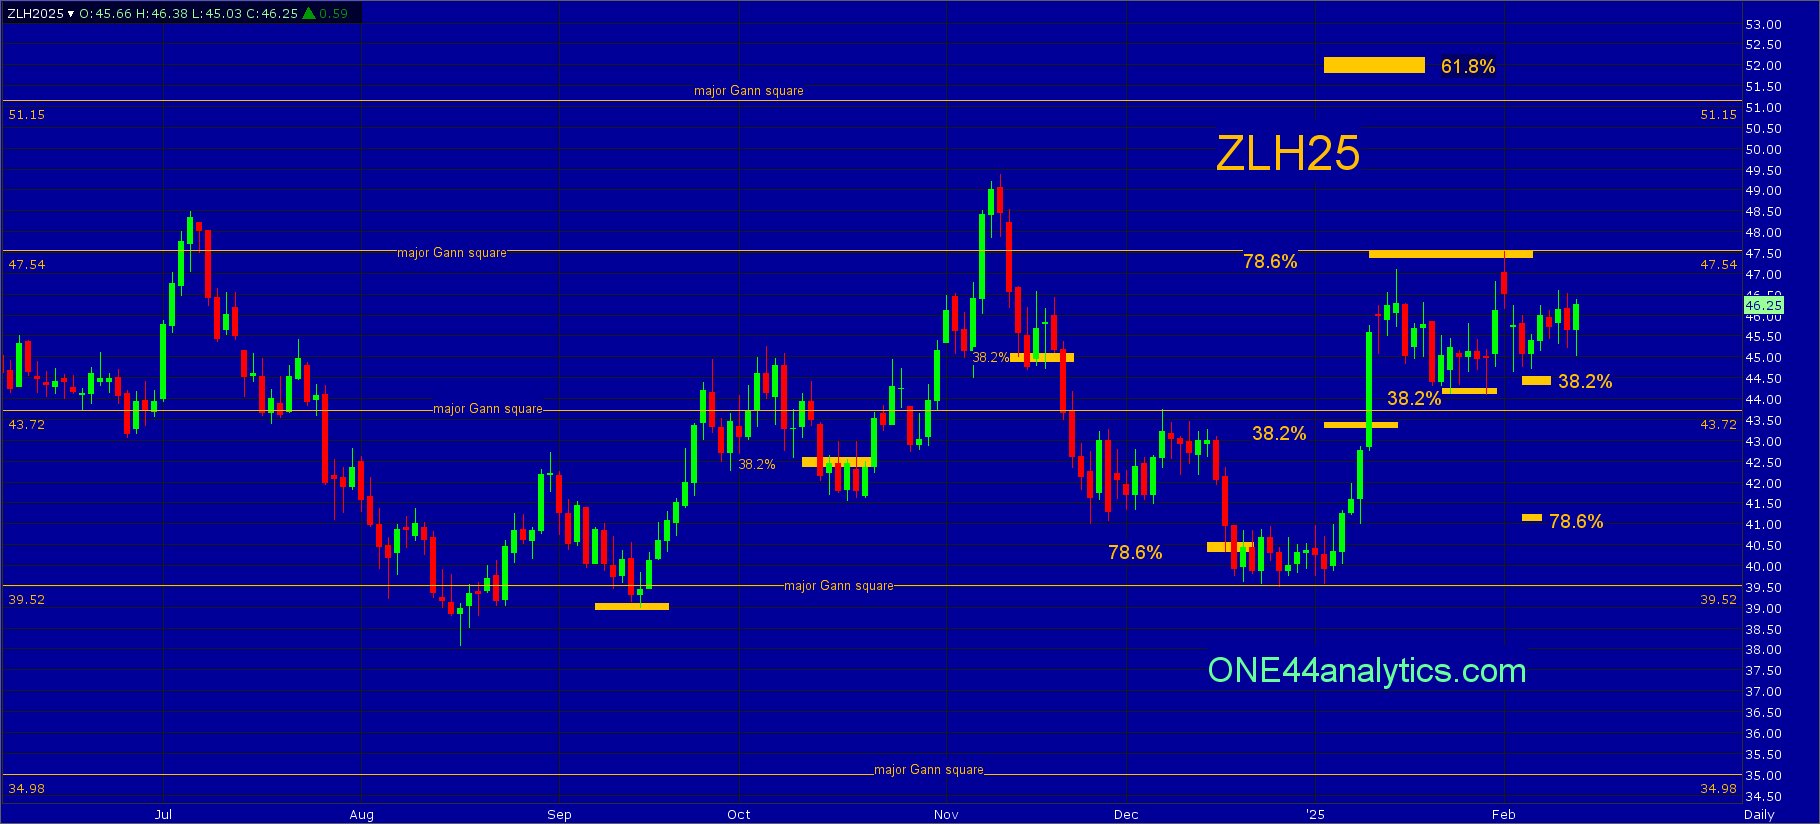
Law of Vibration chart for short term support and resistance
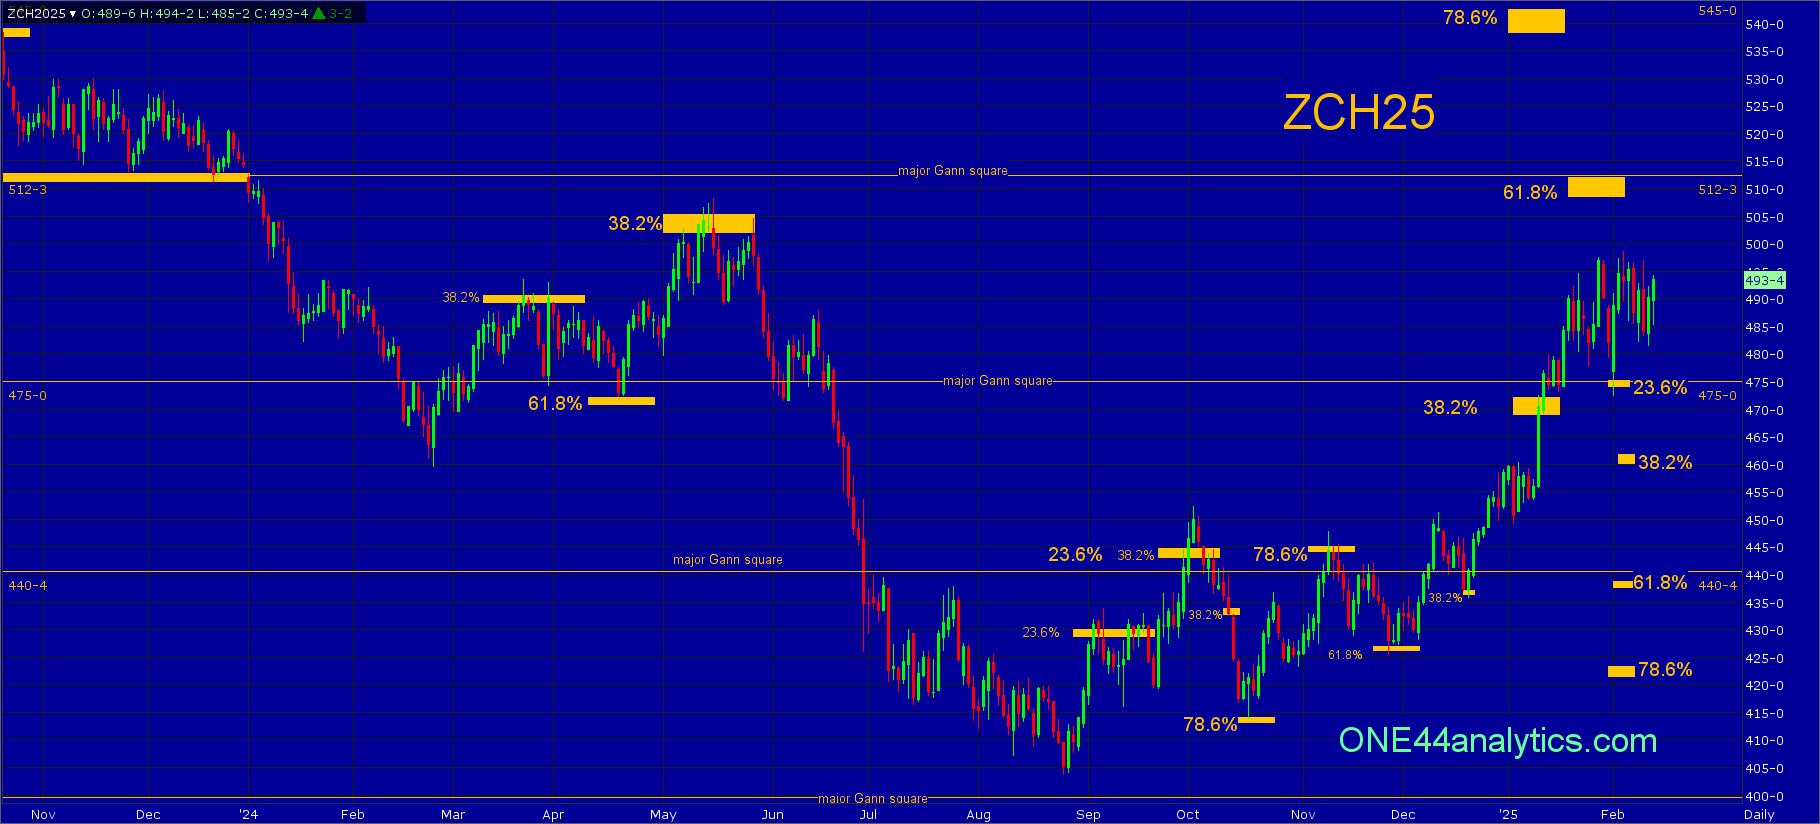
Corn
| Trend | Swing Point | Target | |
|---|---|---|---|
| Long Term | 472.00 | 512.00 | |
| Intermediate Term | 458.00 | 512.00 | |
| Short Term | 548.00 | 512.00 | |
| As of: 2/13/2025, 2:02:30 PM | |||
March
From last week,
The spike down on Monday held the 475.00 major Gann square and 23.6% retracement keeping the trend extremely positive. We continue to look for the area of 508.00/512.25. With a slightly higher high the 23.6% level moves up to 475.75, however we are going to keep the same swing point 475.00 because of the major Gann square. The Above/Below remain the same.
Use 475.00 as the swing point for the week again.
Corn remains in a very strong position above the tightest 23.6% retracement at 475.00. Without making a new high, or low all the levels from last week remain the same.
Use 475.00 as the swing point for the week again.
Above it, the short term target area is 61.8% back to the contract high at 508.00 and the 512.25 major Gann square. Keep in mind a setback from a 61.8% level can send this market 61.8% the other way per the ONE44 61.8% rule, this level is yet to be determined. The long term target area is 78.6% back to the contract high at 538.00 and the 545.00 major Gann square.
Below it, the short term target is 38.2% back to the 8/26/24 low at 461.50, this is the long term swing point now, holding this area can send it back to a new high. The longer term target is the area of the 440.50 major Gann square and 61.8% to the same low at 439.00.
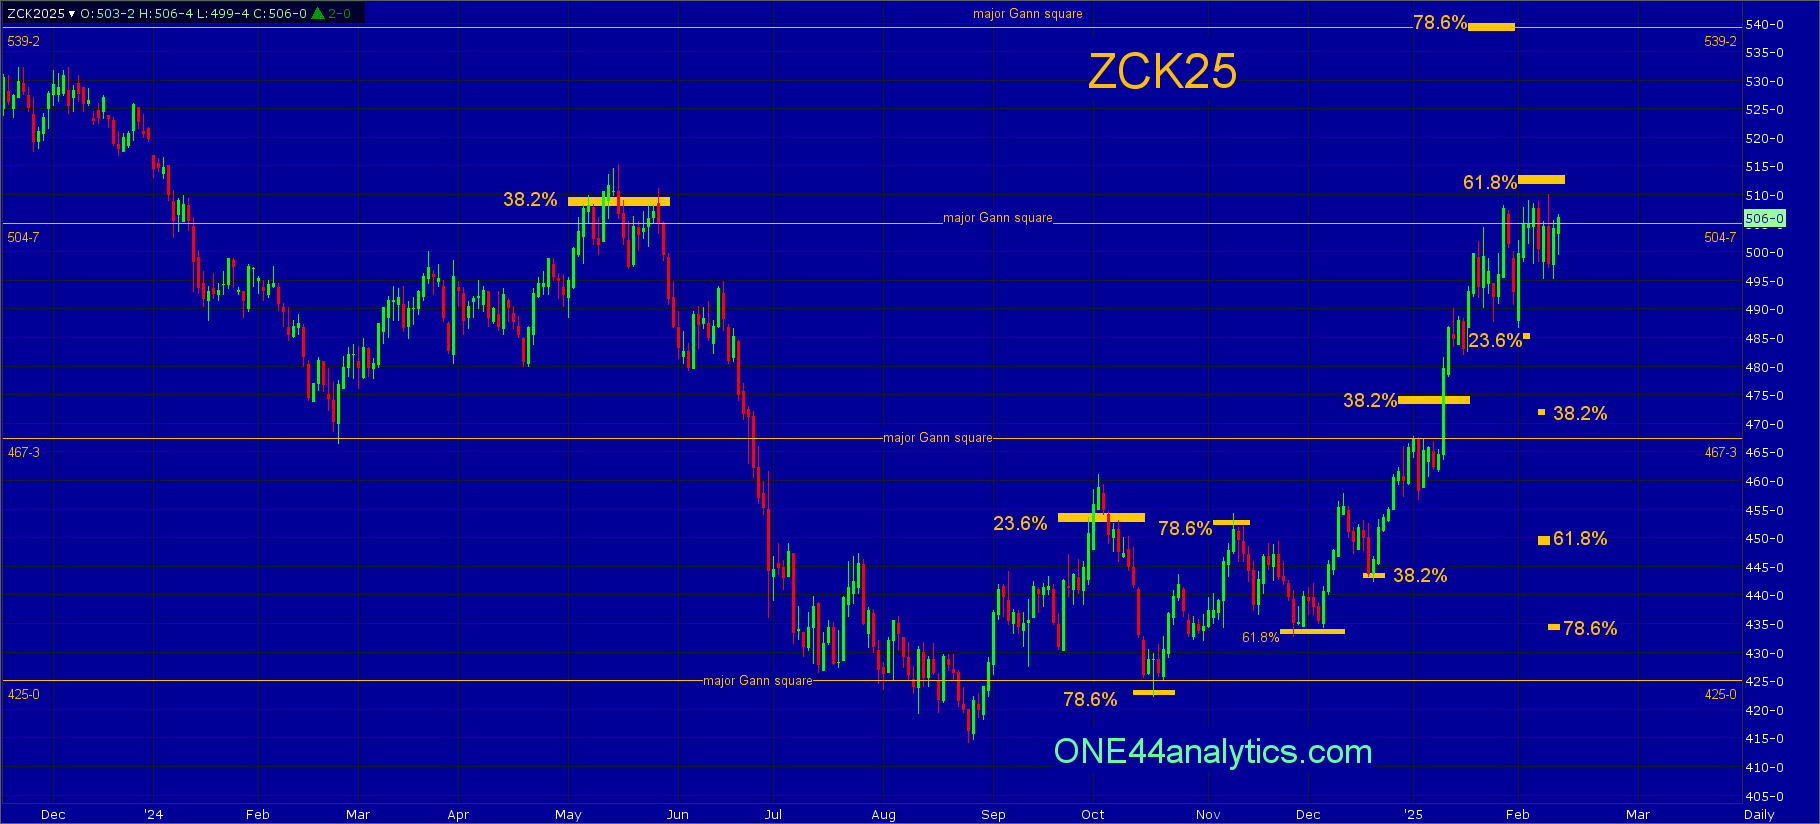
May
From last week,
The spike down on Monday held the 23.6% level at 486.00 (swing point) keeping the short term trend extremely positive. It made a slightly higher high and is getting close to 61.8% at 512.00, this is a level that can cause a bigger setback, so it will be the key level for next week.
Use 512.00 as the swing point for the week.
May also remains in a very strong position. It made a slightly higher high, but is still short of the 618.% level at 512.00, this level will again be key for the next week. All the levels Above/Below are the same for this week.
Use 512.00 as the swing point for the week again.
Above it, you still have to watch for a trade up to, or above 512.00 and a close below the 504.75 major Gann square, as this can cause a quick selloff. The short term target is 539.25, this is 78.6% and a major Gann square. The long term target is 571.75, this 38.2% on the continuation chart and a major Gann square.
Below it, the short term target is 38.2% back to the 8/26/24 low at 472.00, this is now the long term swing point, holding it can send quickly to a new high. With it being close to the 61.8% level at 512.00 the longer term target will be 61.8% the other way at 450.00 per the ONE44 61.8% rule.
Law of Vibration chart for short term support and resistance

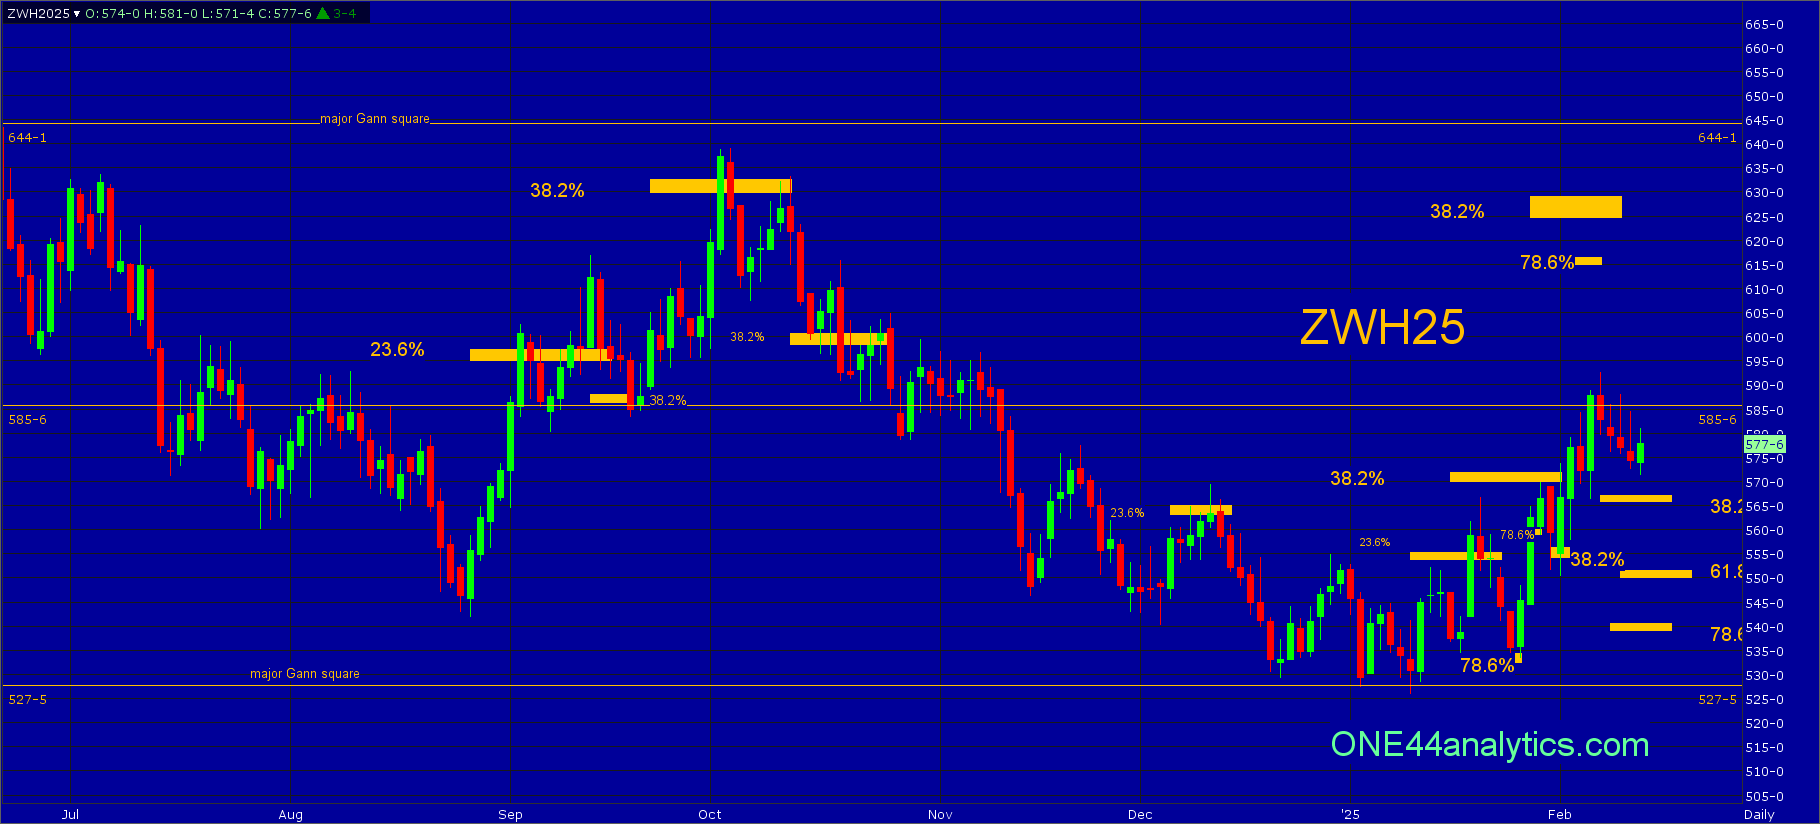
Wheat
| Trend | Swing Point | Target | |
|---|---|---|---|
| Long Term | 670.00 | 464.00 | |
| Intermediate Term | 610.00 | 495.50 | |
| Short Term | 565.00 | 610.00 | |
| As of: 2/13/2025, 2:06:10 PM | |||
March
From last week,
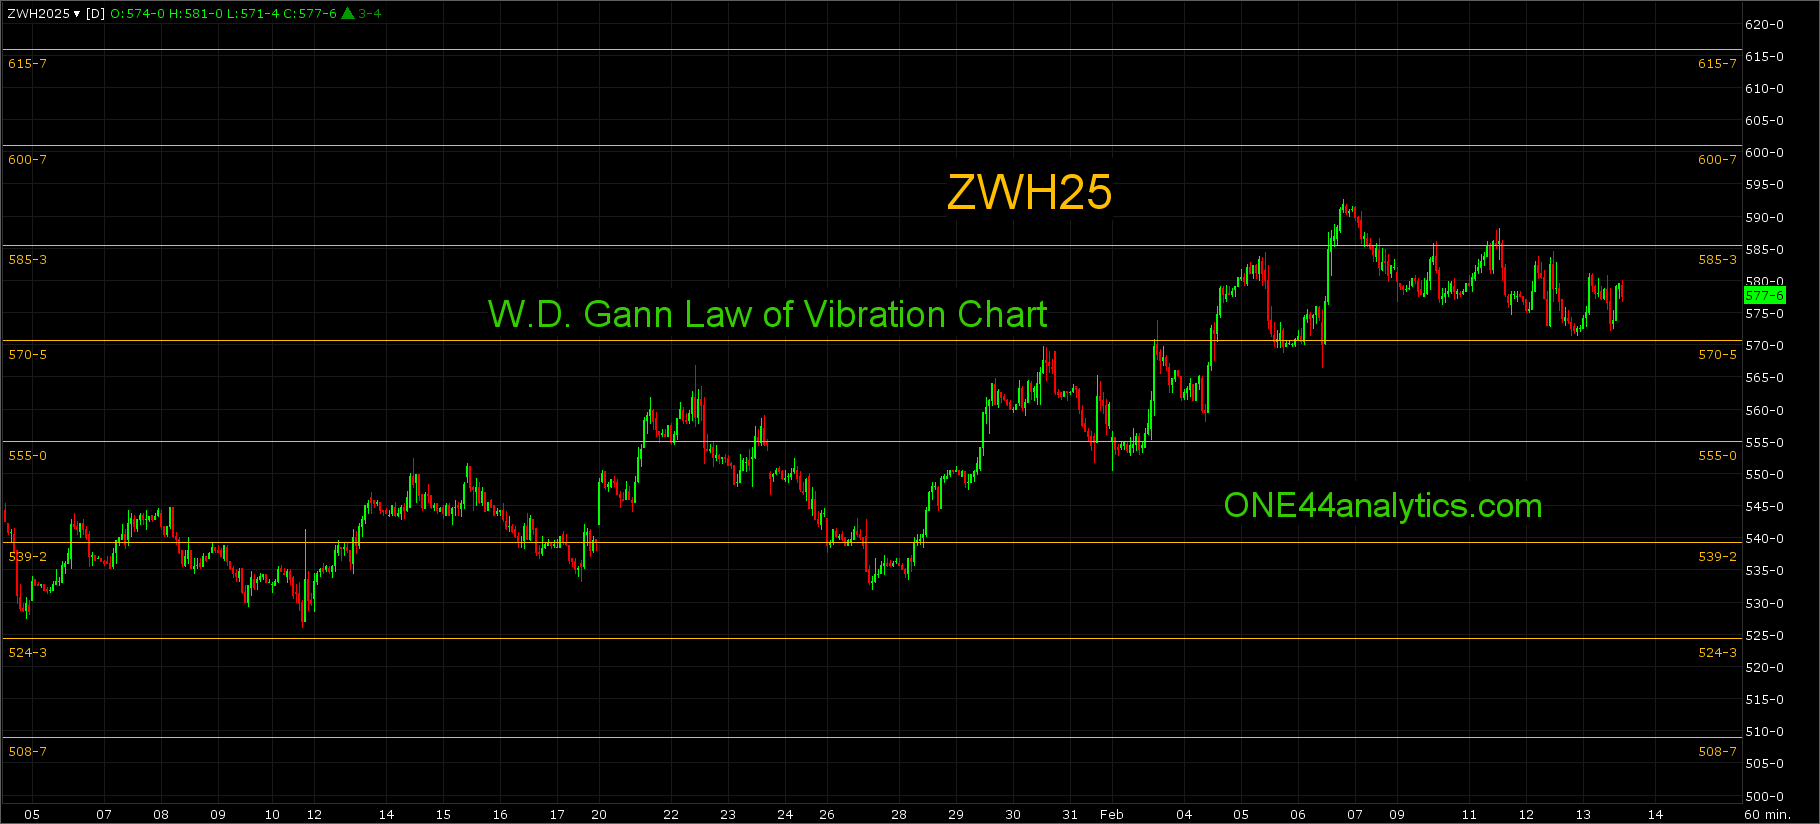
Wheat got the second positive sign of a trend change after failing to make a new low at a 78.6% (534.00, 1/27/25) and now holding 38.2% back to the 1/10/25 low at 555.00. The rally from there has now hit the 585.75 major Gann square that was also the short term target, this will be the key level for the next week.
Use 585.75 as the swing point for the week.
March made a new high this week, but failed to get a close above the 585.75 major Gann square. On the plus side the setback so far has been unable to even get 38.2% to the 1/10/25 low keeping the short term trend positive. The 585.75 major Gann square will be key for the next week again.
Use 585.75 as the swing point for the week again.
Above it, the short term target area on a rally from here is 78.6% back to the 10/2/24 high at 616.00 and 38.2% back to the 5/28/24 high at 625.00, this is also the long term swing point.
Below it, look for 78.6% back to the 1/10/25 low at 540.00. Any setback that holds the new 38.2% at 567.00 keeps the short term trend positive and a new high can quickly follow, just as it did last week.
May
From last week,
The setback from the 580.25 swing point held 38.2% at 565.00 and this was a very positive sign and it quickly went on to a new high. Today it closed above the 23.6% level at 593.00 and this will be the key level for the next week.
Use 593.00 as the swing point for the week.
Below it, getting right back below 593.00 tomorrow can send this market back to test the recent low. The long....
It made a new high this week before getting back below the 593.00 (23.6%) swing point, the positive thing is, that getting back below it couldn't even get it back 38.2% to the 1/10/25 low keeping the short term trend positive. Today it is right back at 593.00 and this will remain the key level for the week.
Use 593.00 as the swing point for the week again.
Above it, look for the area of 38.2% back to the contract high at 628.00 (long term swing point) and the 634.75 major Gann square. The long term target is 61.8% of the same move at 681.00.
Below it, the long term target is 78.6% back to the 1/10/25 low at 552.00. The short term target is 38.2% back of the same move at 578.00, holding this level keeps the short term trend positive and new highs can quickly follow just as it did last week.
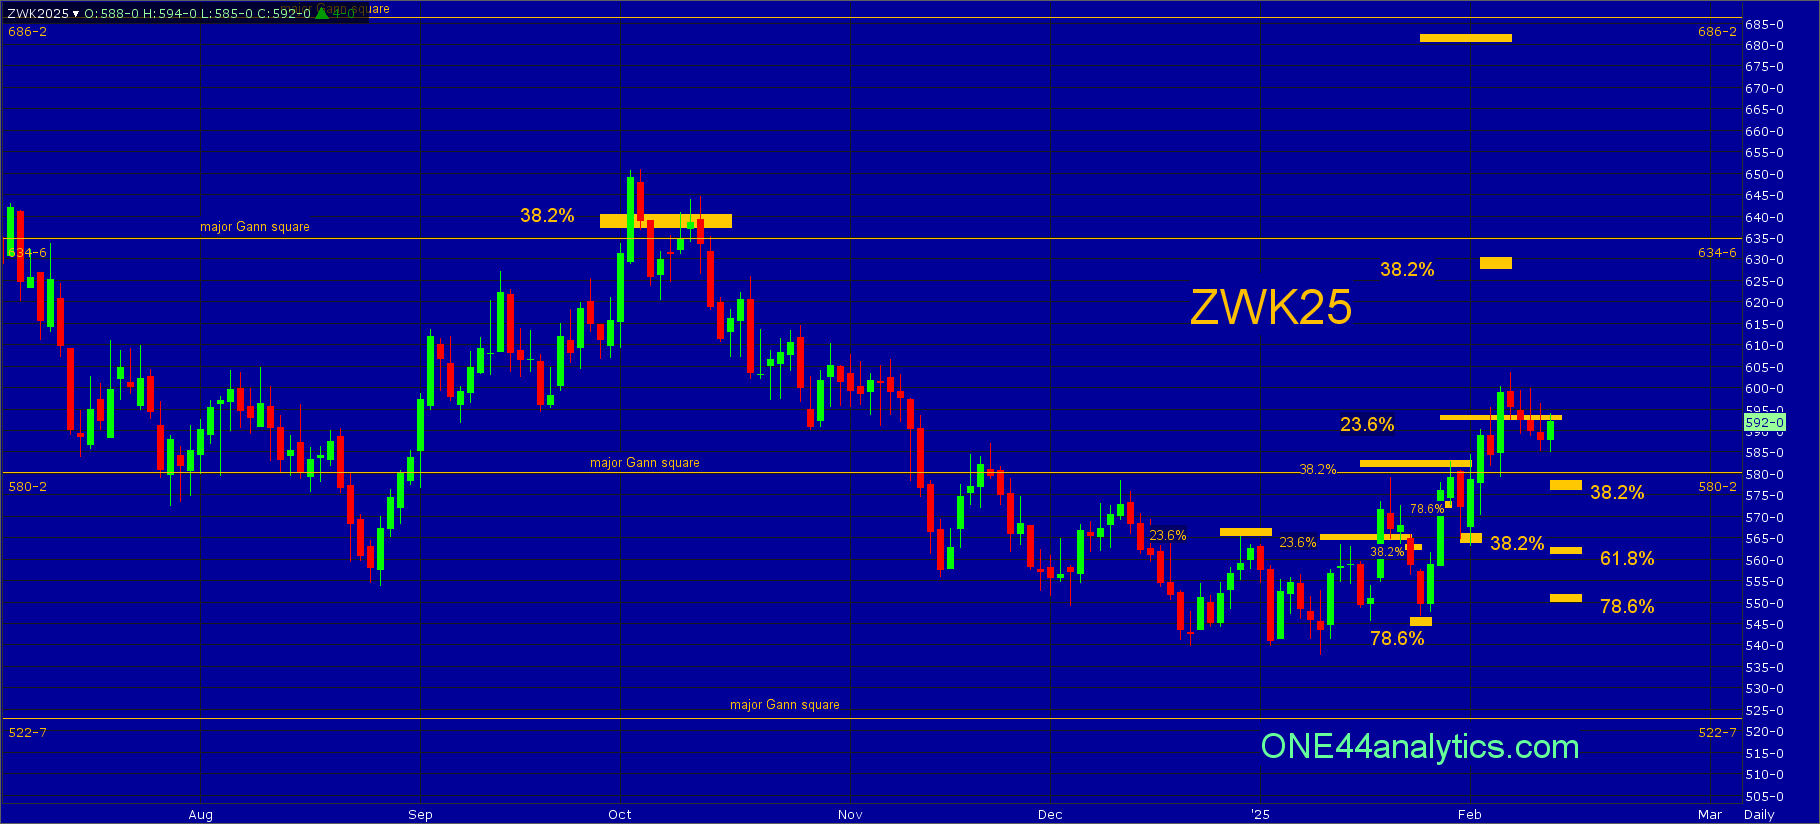
Law of Vibration chart for short term support and resistance
Livestock
Cattle
April
From last week,
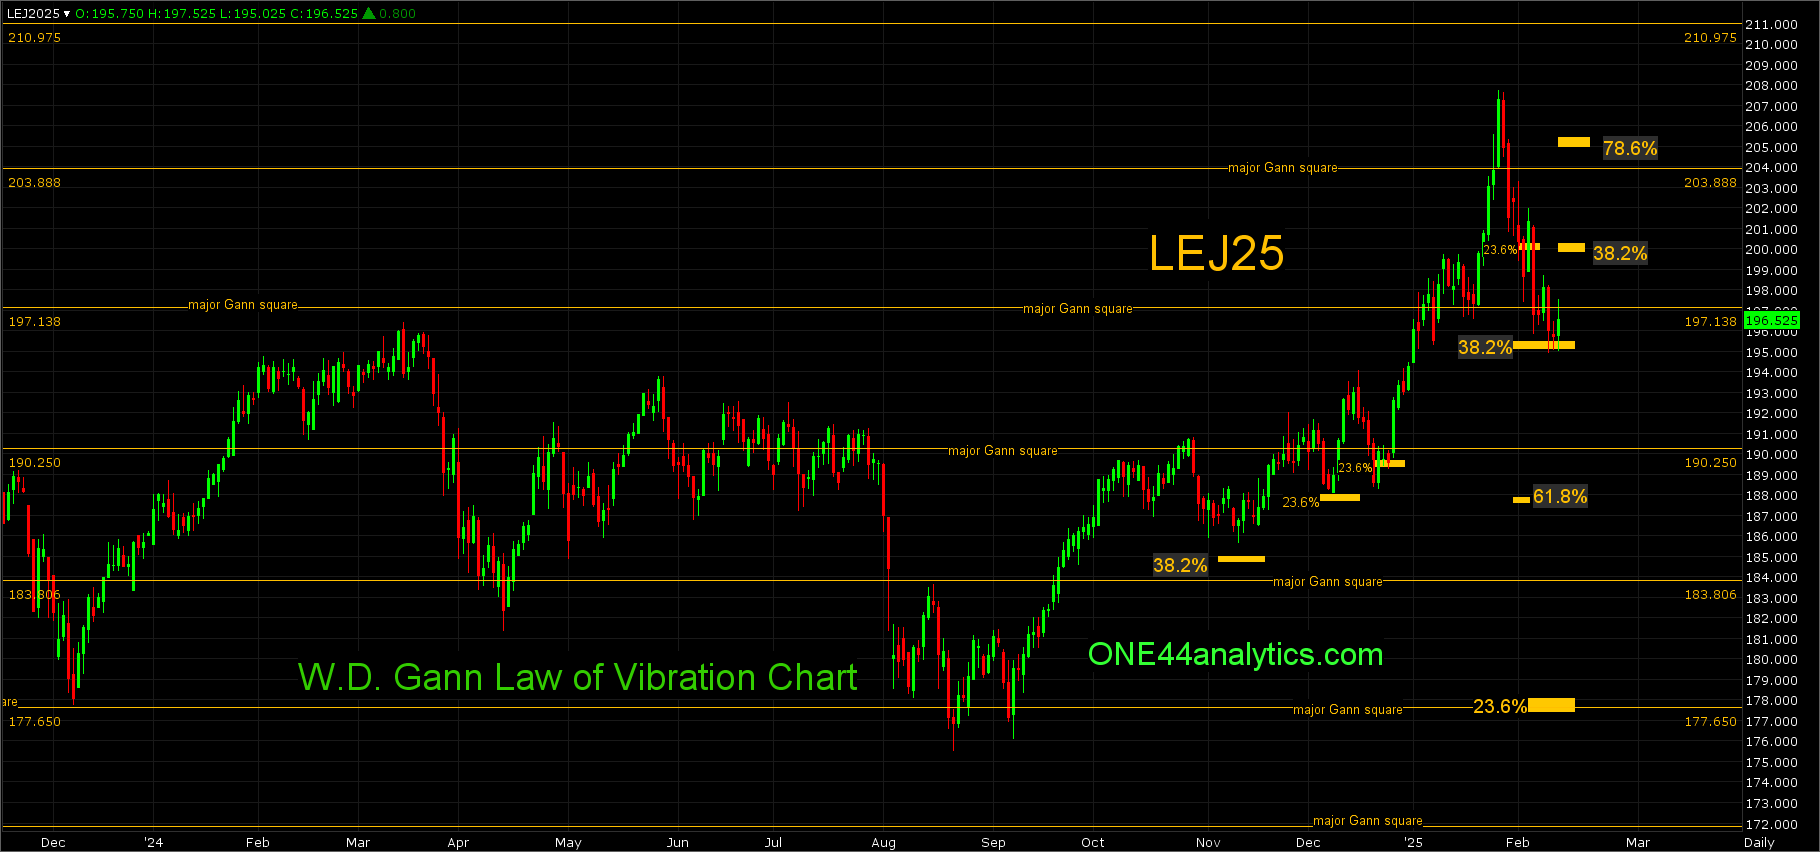
The selloff fell just short of the long term swing point at 195.50 today, this level will be key for the next week. Holding it can send it right back up to test the recent high and if so we will be looking for 78.6% back to the 1/28/25 high. A failure to hold it turns the long term trend negative and 61.8% is next.
Use 195.50 as the swing point for the next week.
The last 3 days have held 195.50, however there has been no rally from it as of yet. This is the long term swing point and it has the potential to send this market right back to a new high. As always we will watch all the retracements on any rally to see just how strong, or weak the market is.
Use 195.50 as the swing point for the week again.
Above it, the target area is the 203.88 major Gann square and 78.6% back to the 1/28/25 high at 205.00. Any rally that can't get above 38.2% of the same move at 200.00 would be a negative sign, especially rallying from the long term swing point.
Below it, turns the long term trend negative, the short term target area is the 190.25 major Gann square and 61.8% back to the 8/21/24 low at 188.00. The long term target is 23.6% on the continuation chart at 177.65, this is also a major Gann square.
Feeder Cattle
March
From last week,
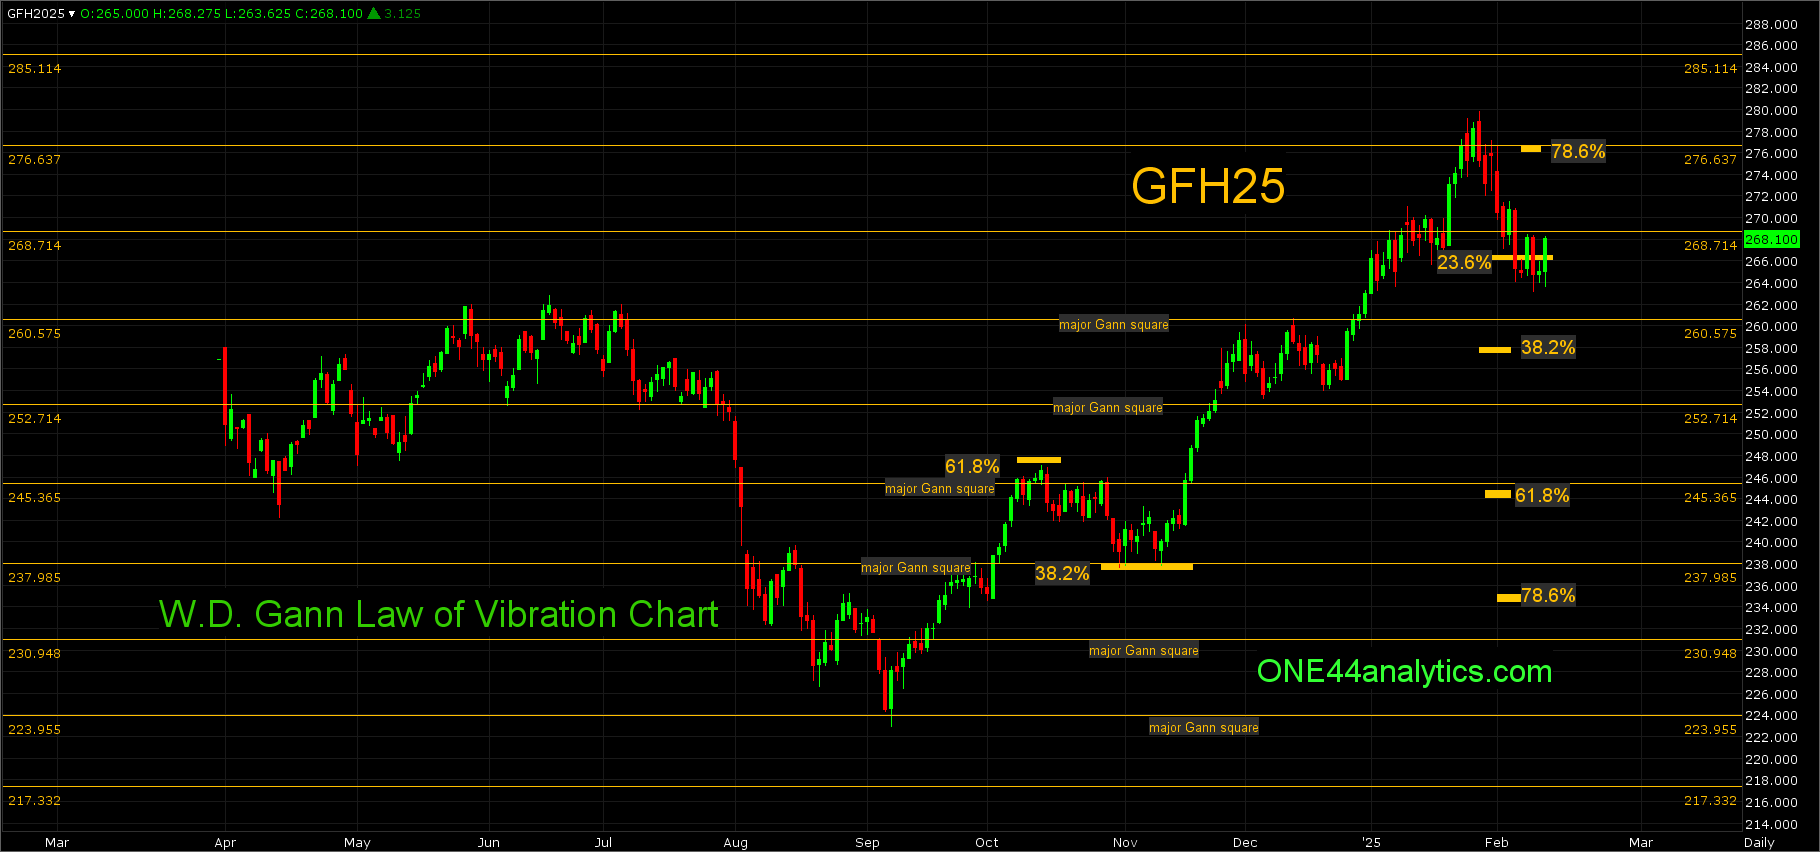
This week's break from the 276.63 major Gann square and swing point for the week closed below 23.6% at 266.44 today, this level will be key for the next week.
Use 266.44 as the swing point for the week.
It spent the week trading around the 266.44 (23.6%) swing point for the week and today it closed back above it. This will remain the key level for next week.
Use 266.44 as the swing point for the week again.
Above it, with this being 23.6%, it can send it to a new high and the 285.11 major Gann square. The short term target is 78.6% at 276.63, this is also a major Gann square. A failure to make a new high in the area of a 78.6% retracement can send this market quickly lower (ONE44 78.6% rule). Any rally that can't get back above the 268.71 major Gann square is a negative sign and a new low can quickly follow.
Below it, look for the long term swing point at 258.00, this is 38.2% back to the 9/9/24 low. A failure to hold 258.00 will give us a downside target area of the 245.36 major Gann square and 61.8% of the same move at 244.80.
Lean Hogs
April
From last week,
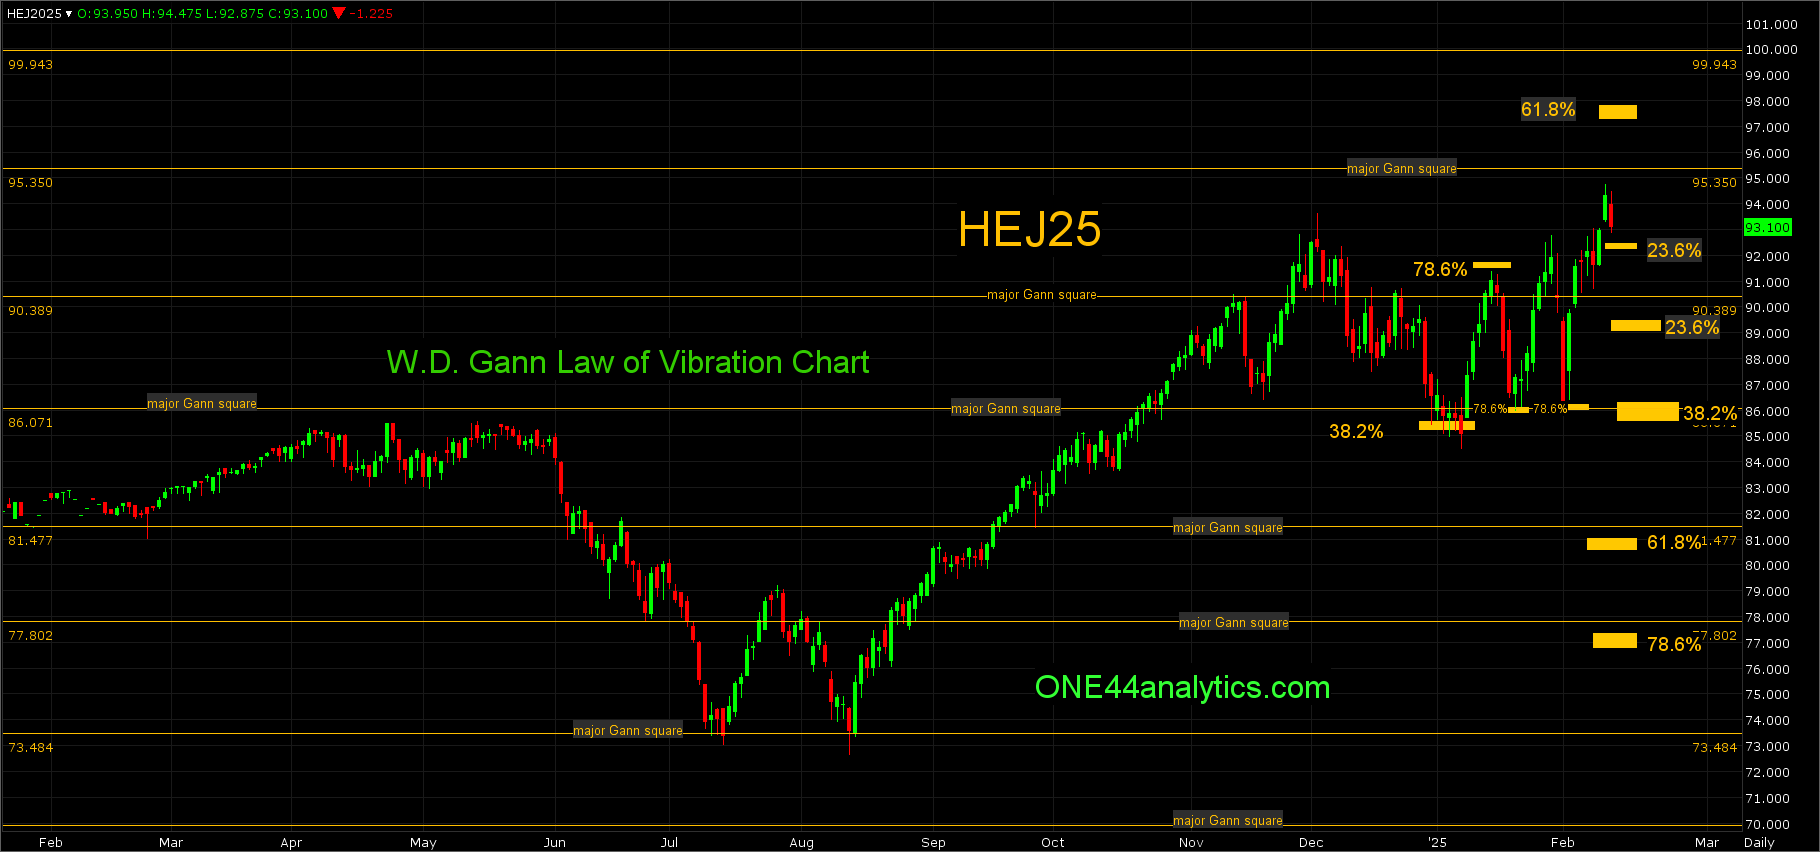
The break last Friday held just above 78.6% and major Gann square at 86.07 and quickly rallied right back to and through the 90.39 swing point for the week, this will again be the key level for the next week. Even with the wide swings between the 78.6% retracements it is still above the long term swing point of 85.50 that it hit on 1/7/25 and this can still send it to a new high.
Use 90.39 as the swing point for the week again.
Above it, the short term target is the next major Gann square at 95.35. The longer....
It made a new high this week, but fell short of the 95.35 major gann square. With the new high we are going to make the swing point as tight as possible. We are using 23.6% back to the 1/8/25 low at 92.50.
Use 92.50 as the swing point for the week.
Above it, look for 61.8% on the continuation chart at 97.30. The long term target is 78.6% of the same move at 104.65. A close above the 95.35 major Gann square will make it the new swing point for the week.
Below it, the short term target area is 38.2% back to the 8/13/24 low (long term swing point) at 86.40 and the 86.07 major Gann square. Any setback that holds 23.6% of the same move at 89.60 keeps the trend extremely positive and a new high can quickly follow.