Weekly Grain/Livestock Update 2/27/25

We hope you have watched our latest video,
ONE44 Analytics, Fibonacci retracements, How the Grains put in their Bottom.
ONE44 Analytics sends an email to every Premium Member when the Weekly update is done on Thursdays, if you do not receive one, please check your spam folder, or make sure you are signed up for the emails in your ONE44 account settings.
Being this is a weekly update we give all the key levels to watch for the week using Fibonacci retracements and Major Gann squares. We set up scenarios to look for when a level holds, or fails based on these methods, so it is very important to know for yourself how to use them following the ONE44 rules and guidelines. The best way to get a better understanding of these methods is to read all the posts (even if not on Grains) and watch our YouTube videos, as we explain why we think what we think based on the rules and guidelines. It is also important to view all the charts, as they have the key levels marked on them, if there are extended moves.
Thank You to all the new subscribers!
To all our Subscribers, when you are logged in to our website you will get all of the content in every post, so it may look like every Member/Non Member is getting the same thing. Please be assured that what you are paying for as a Premium Member of "Grains Weekly" is only accessible by you and is not posted anywhere else for free. This can be proven by logging out and trying to get the full article that has a yellow star with it. One exception is we will occasionally post articles on Barchart.com with excerpts from our website and Videos to draw people to the website.
Soybeans
| Trend | Swing Point | Target | |
|---|---|---|---|
| Long Term | 1261.00 | 980.00 | |
| Intermediate Term | 1092.00 | 985.00 | |
| Short Term | 1040.00 | 1085.00 | |
| As of: 2/27/2025, 11:17:43 AM | |||
May
From last week,
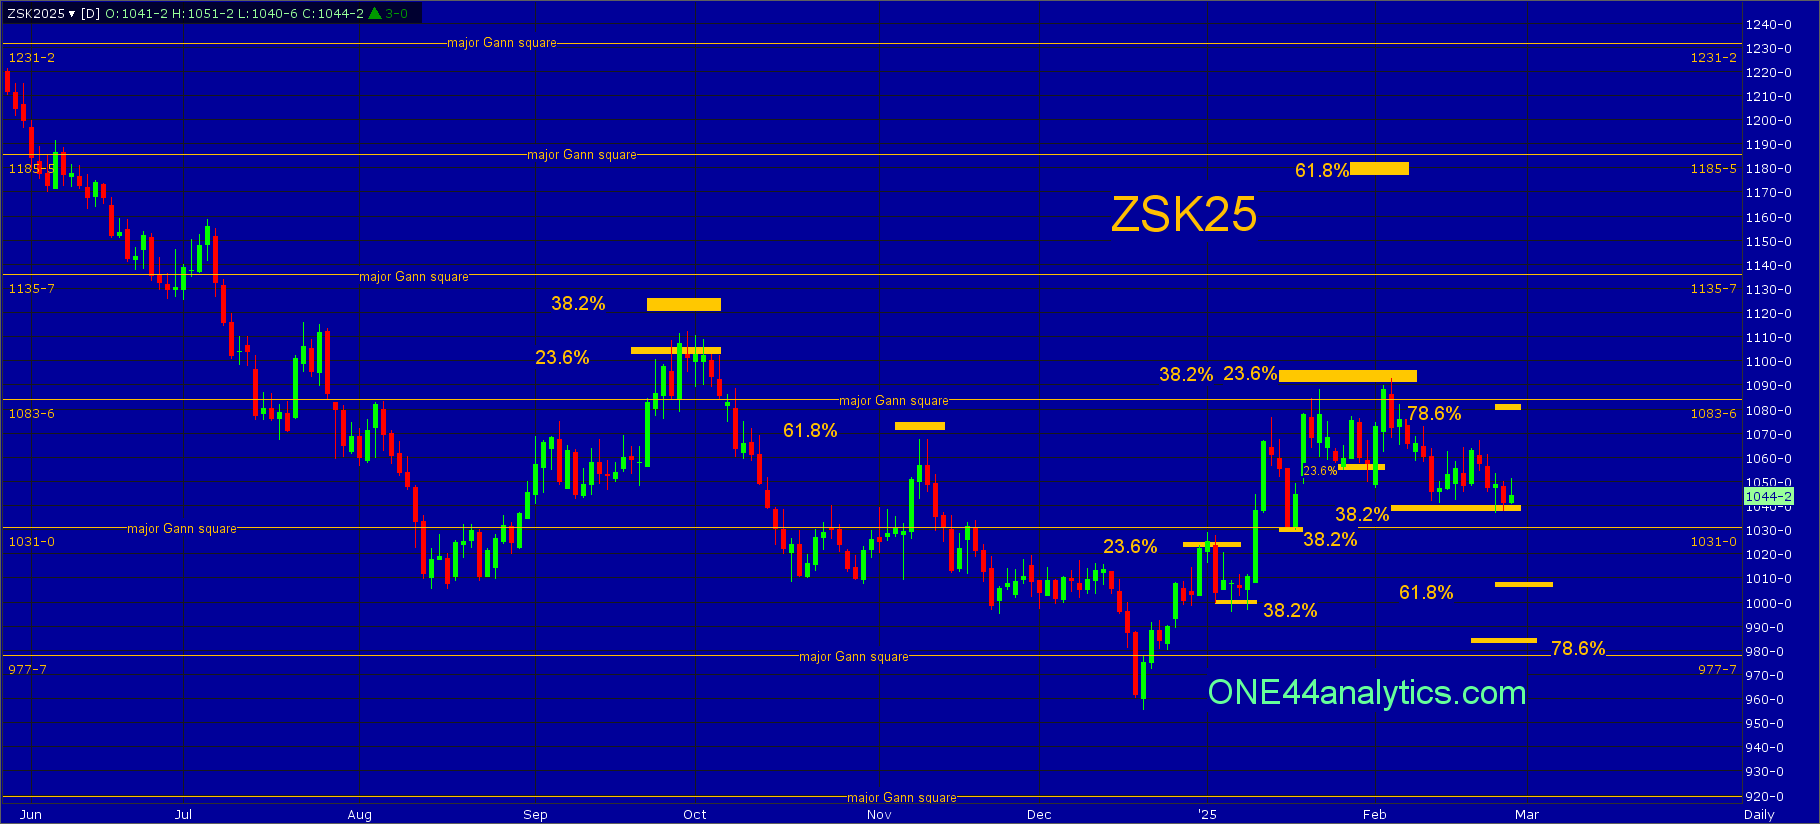
It did have a small range for the week, however it stayed above the 1040.00 (38.2%) swing point for the week keeping the short term trend positive. With no new low all the levels Above/Below remain the same for this week.
Use 1040.00 as the swing point for the week again.
The rally from the short term swing point at 1040.00 (38.2%) could only get to 1066.75 and the setback from there has it right back on 1040.00. This level will again be key for the next week. Above the 78.6% level has moved down to 1080.00 and we are adding in 61.8% below for the short term target. With not much of a rally from 1040.00 you will still have to watch for a trade down to the 1031.00 major Gann square and a close back above it (1040.00).
Use 1040.00 as the swing point for the week again.
Above it, if this is all it can setback after hitting key longer term retracements above it is a very strong sign and a new high can follow. We will also be watching the 78.6% level back to the 2/5/25 high at 1080.00, a failure to make a new high in this area can send the market quickly lower (ONE44 78.6% rule). When and if it clears 1092.00 the Intermediate trend turns positive and the long term target area is 61.8% back to the contract high at 1174.00 and the 1185.50 major Gann square. Before then is a major Gann square at 1135.75 to look for resistance and then use as the swing point when closed above.
Below it, you still have to watch for a trade down to the 1031.00 major Gann square and a close back above 1040.00 as this can cause a quick rally back to the high. Below 1040.00 turns the short term trend negative and the short term target is 61.8% of the same move at 1008.00, the long term target area is 78.6% at 984.50 and the 977.75 major Gann square.
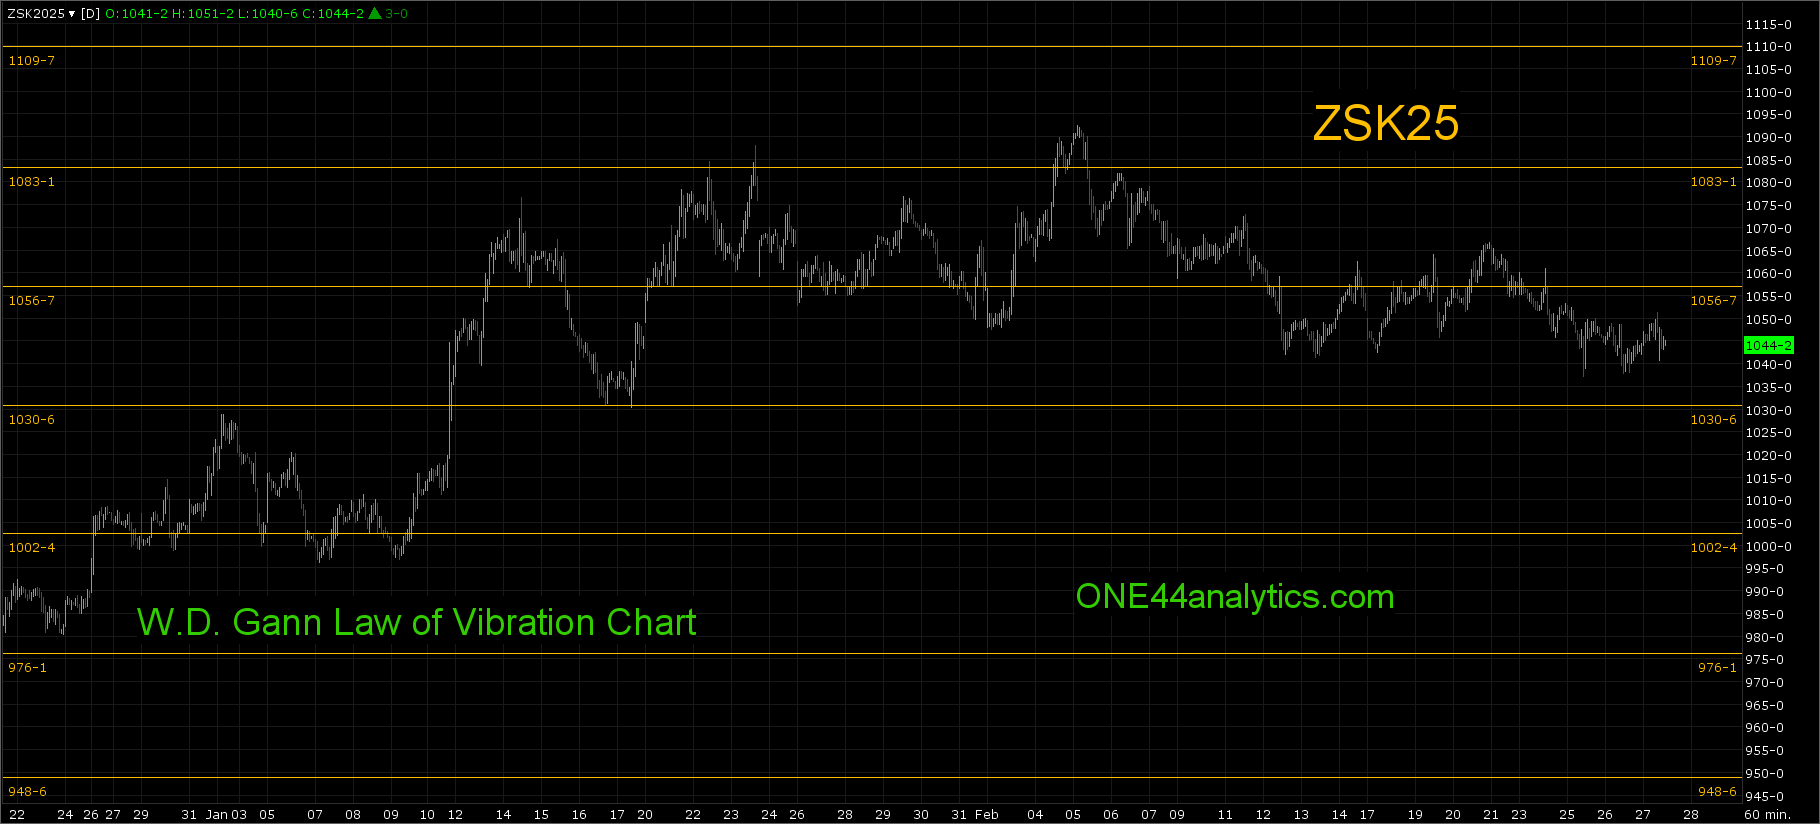
Law of Vibration chart for short term support and resistance
Soybean Meal
| Trend | Swing Point | Target | |
|---|---|---|---|
| Long Term | 335.00 | 274.50 | |
| Intermediate Term | 325.00 | 274.50 | |
| Short Term | 310.00 | 286.00 | |
| As of: 2/27/2025, 11:21:36 AM | |||
May
From last week,
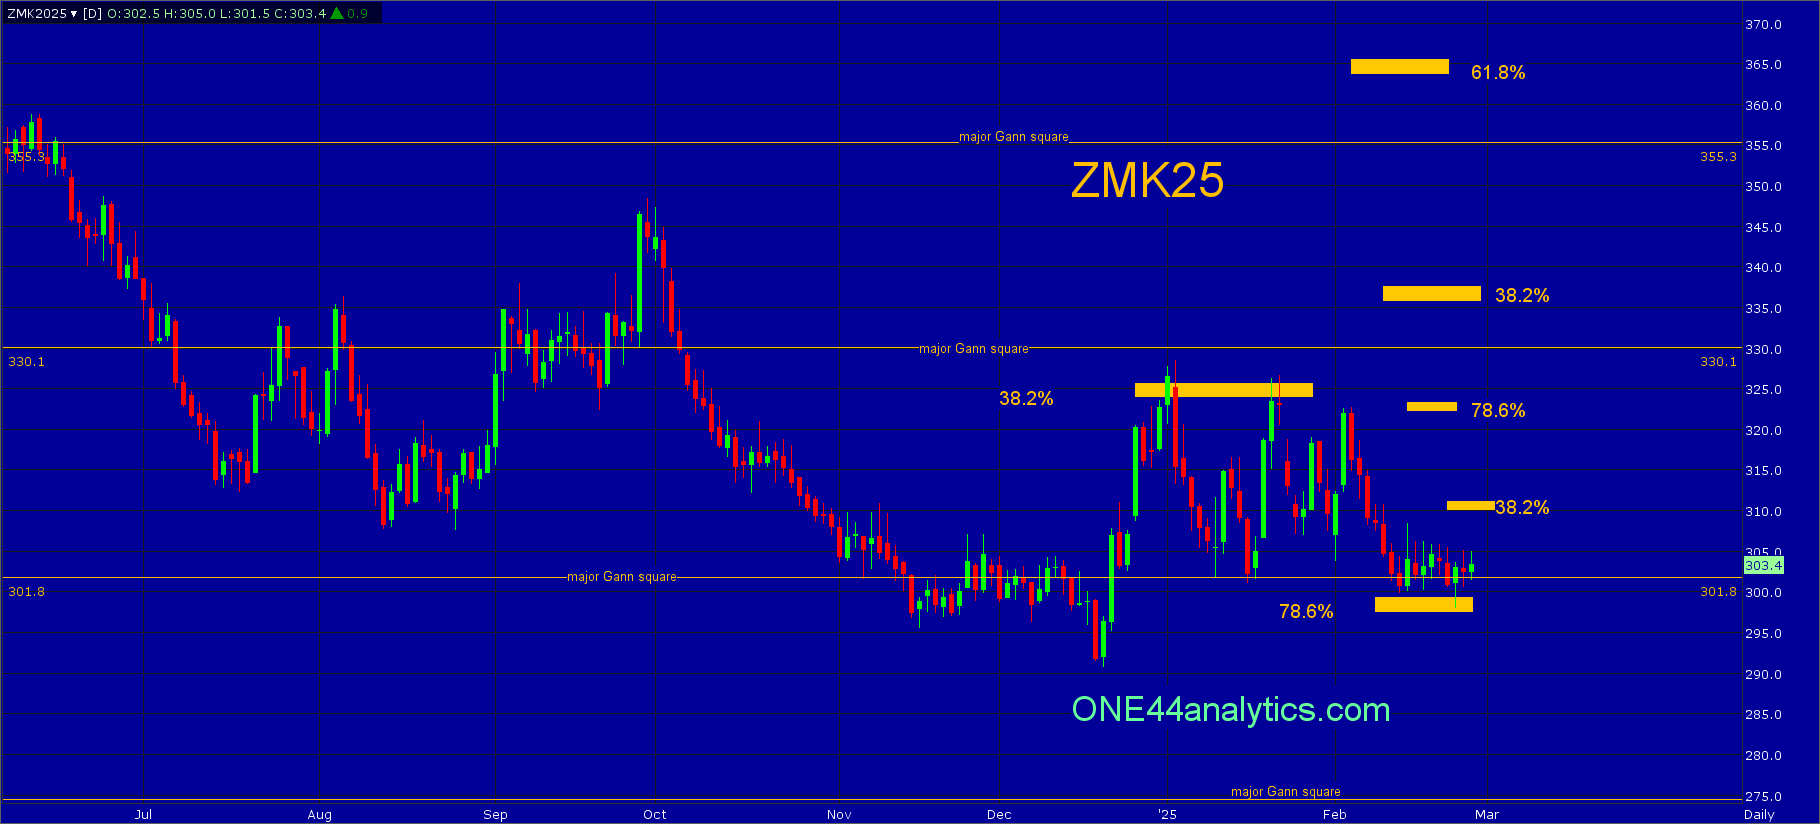
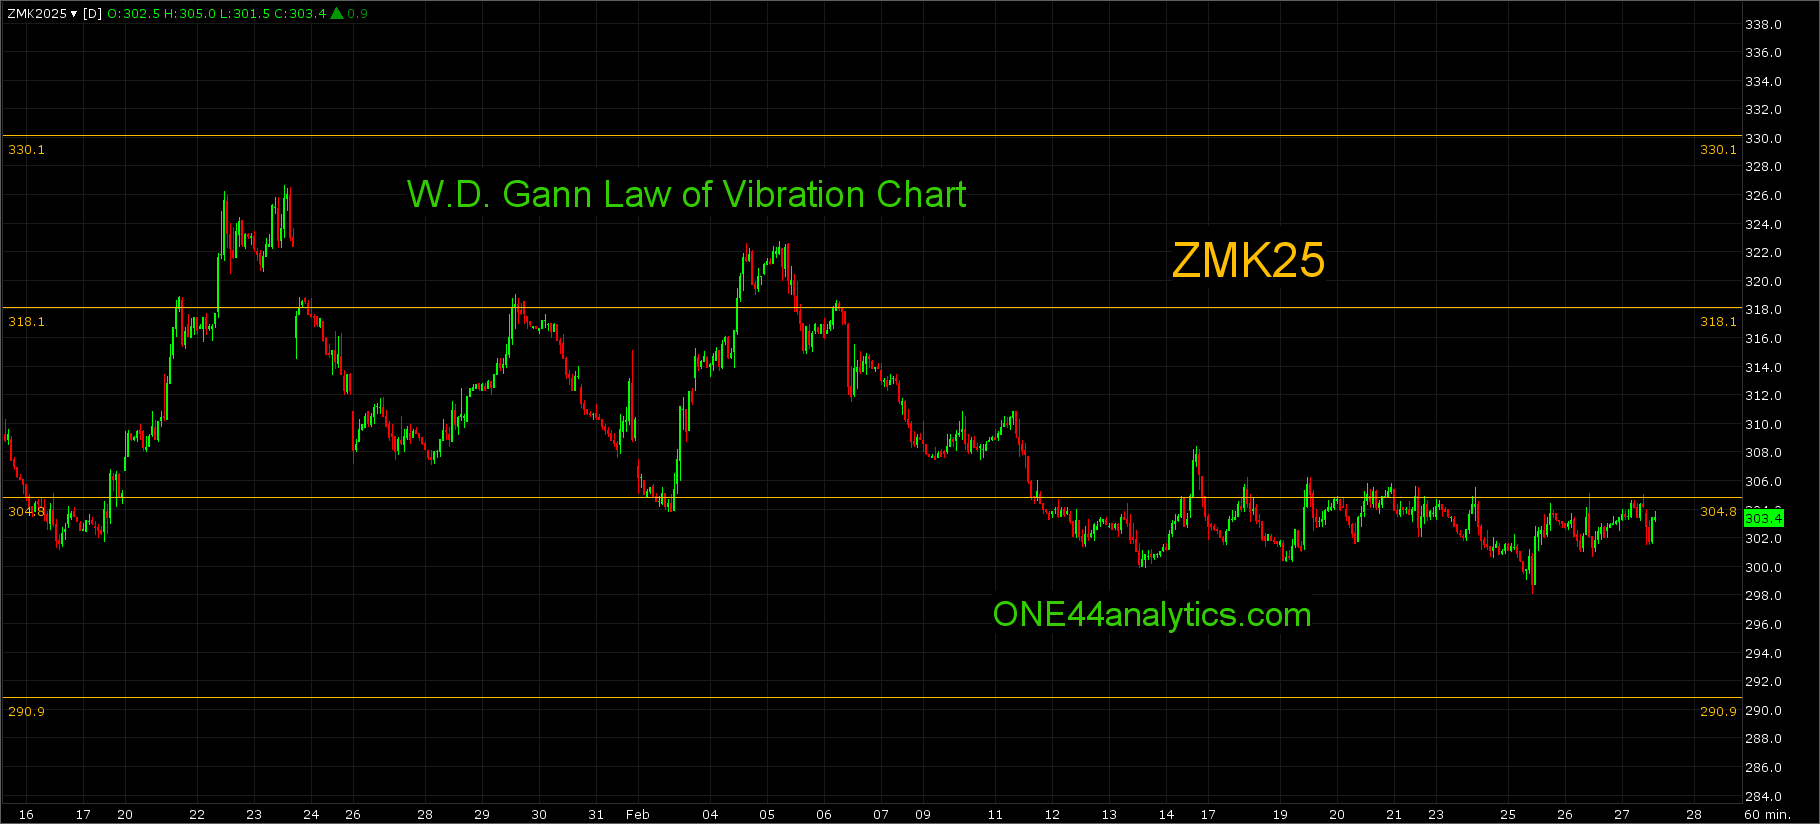
May is sitting on the 301.80 major Gann square and just above 78.6% back to the 12/19/24 low at 299.50 and this will be the key level for the next week.
Use 299.50 as the swing point for the week.
Meal held the 299.50 (78.6%) swing point for the week, however it had a very small range for the week and this level will again be key for the next week. With a slightly lower low the 38.2% level moves down some and the Below remains the same.
Use 299.50 as the swing point for the week.
Above it, following the ONE44 78.6% rule we will be looking for 78.6% the other way at 322.50. The long term target is the long term swing point at 336.00, this is 38.2% back to the contract high. Any rally that can't get above 38.2% at 310.00 is a negative sign and a new low can quickly follow.
Below it, a failure to turn higher from this area will give us only major Gann squares to use for support and then as the swing point when closed below, the next one is 274.50.
Law of Vibration chart for short term support and resistance
Soybean Oil
| Trend | Swing Point | Target | |
|---|---|---|---|
| Long Term | 45.35 | 54.50 | |
| Intermediate Term | 45.35 | 51.00 | |
| Short Term | 45.35 | 47.40 | |
| As of: 2/27/2025, 11:26:31 AM | |||
May
From last week,
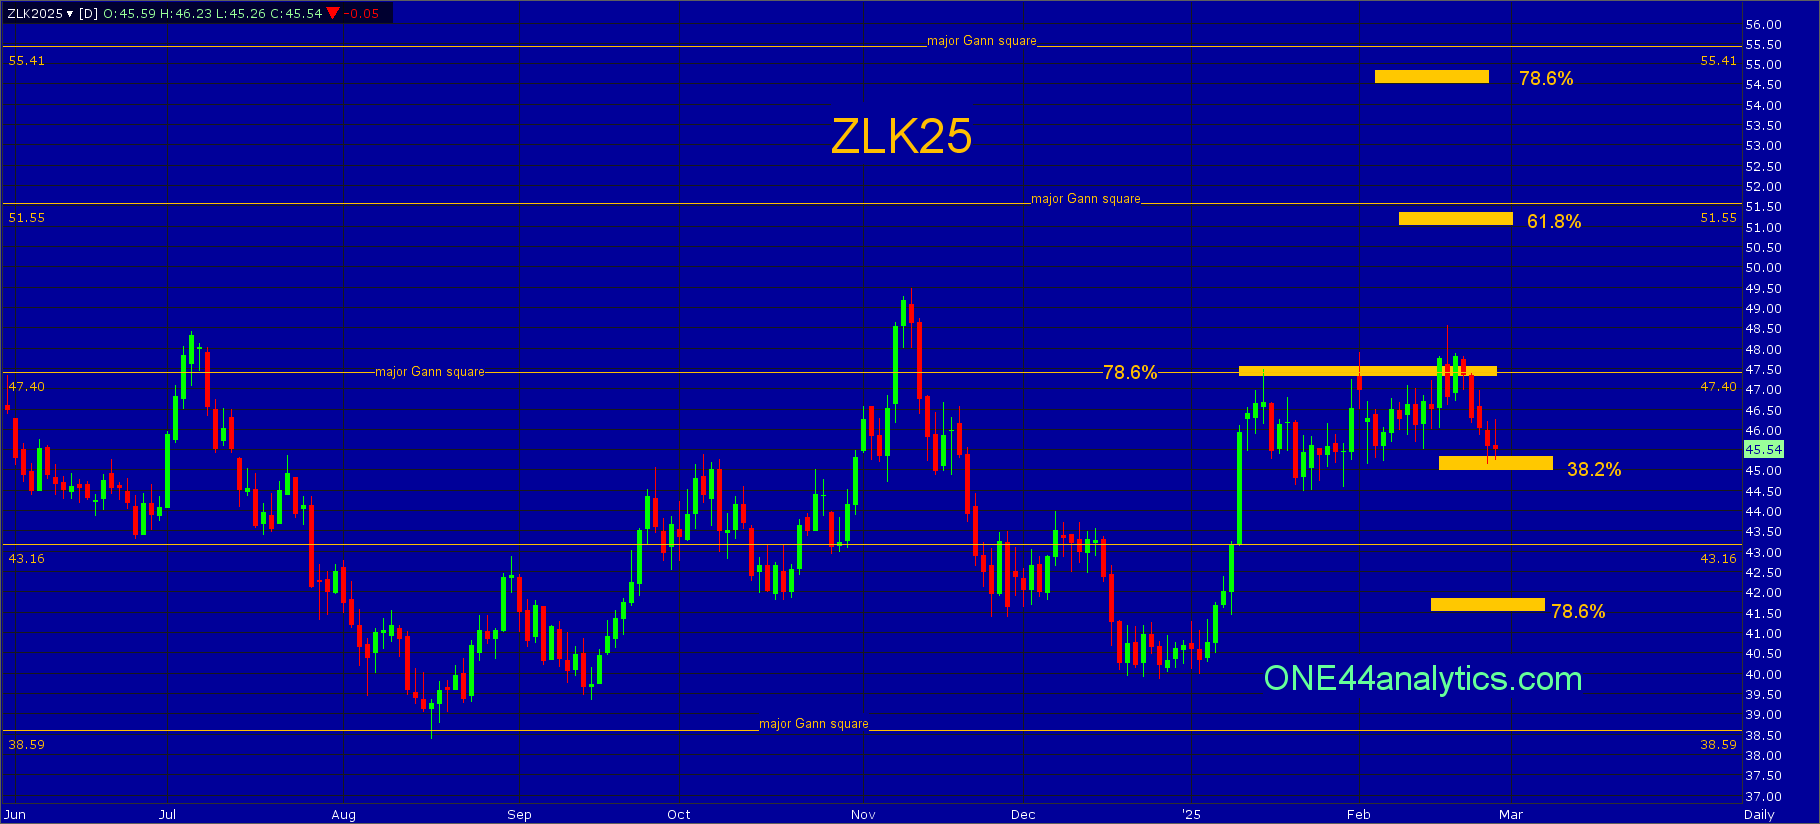
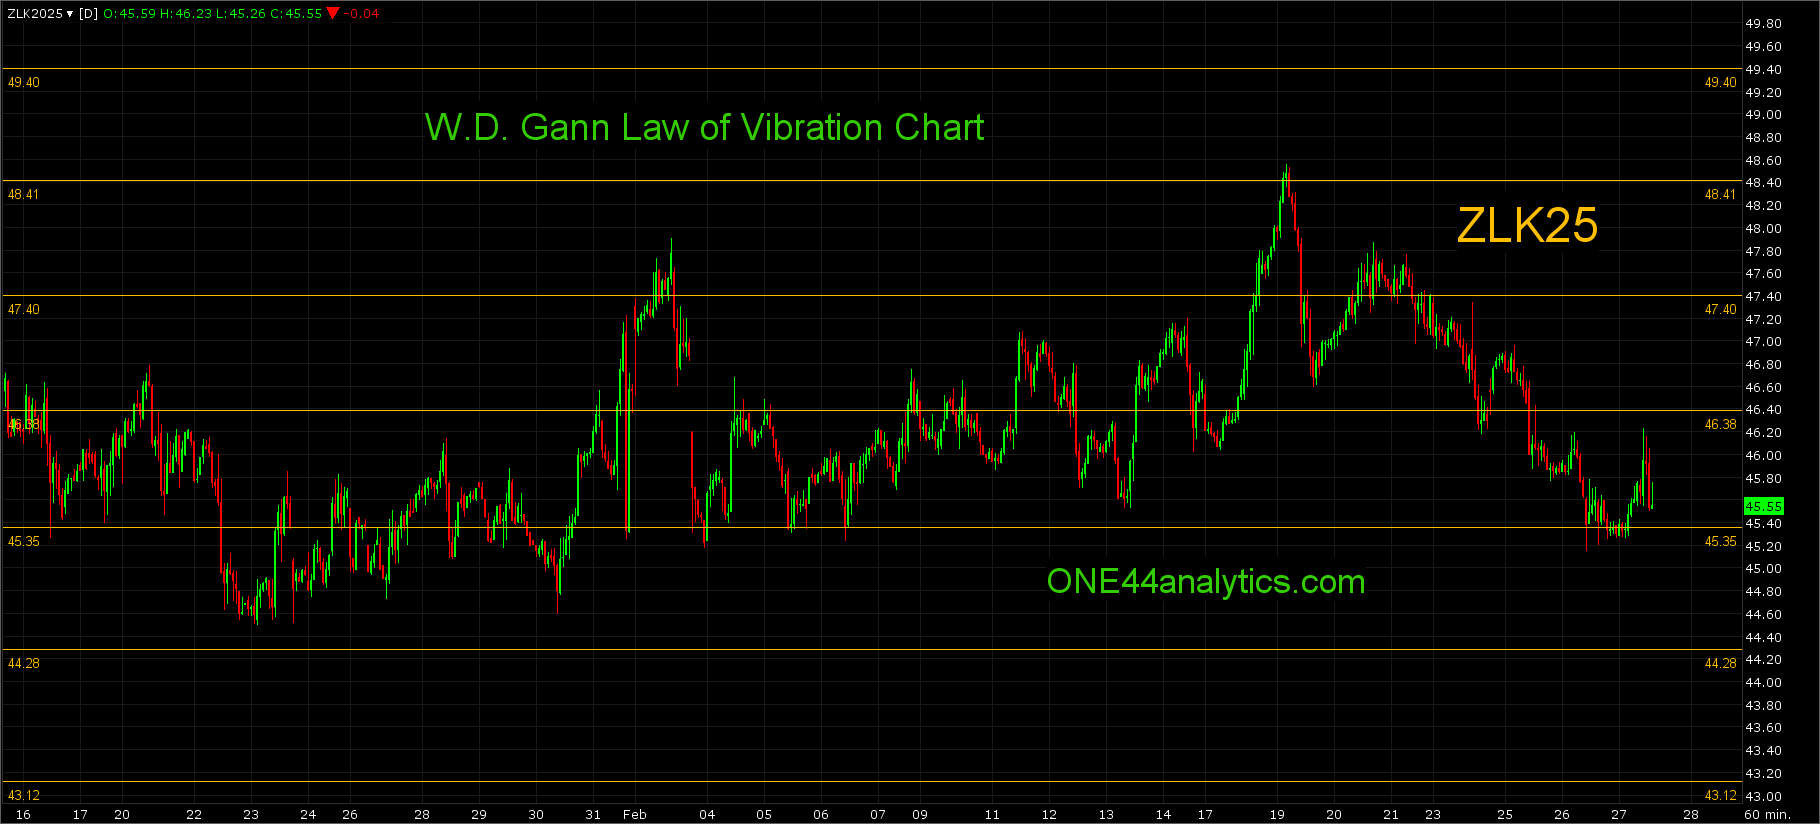
May has been up against the 47.40 major Gann square for over a month, this is also 78.6% of the 11/11/24 high and 12/26/24 low, this will be the key level for the next week.
Use 47.40 as the swing point for the week.
Below it, following the ONE44 78.6% rule we will be looking for 78.6% the other way at 41.80. Any setback that holds 38.2% at 45.35 is a strong sign and it can quickly make a new high for this move up.
The setback from the 47.40 (78.6%) major Gann square and swing point for the week hit 38.2% at 45.35. Holding this level would be a strong sign and new highs can follow, it will be the key level for next week.
Use 45.35 as the swing point for the week.
Above it, the short term target area is 61.8% back to the contract high at 51.05 and the 51.55 major Gann square. The long term target is 78.6% of the same move at 54.55. Any rally that can't get above the 47.40 major Gann square is a negative sign and a quick setback can happen.
Below it, following the ONE44 78.6% rule we will be looking for 78.6% the other way at 41.80. The long term target is the 38.59 major Gann square.
Law of Vibration chart for short term support and resistance
Corn
| Trend | Swing Point | Target | |
|---|---|---|---|
| Long Term | 478.00 | 570.00 | |
| Intermediate Term | 478.00 | 539.00 | |
| Short Term | 478.00 | 514.00 | |
| As of: 2/27/2025, 11:29:29 AM | |||
May
From last week,
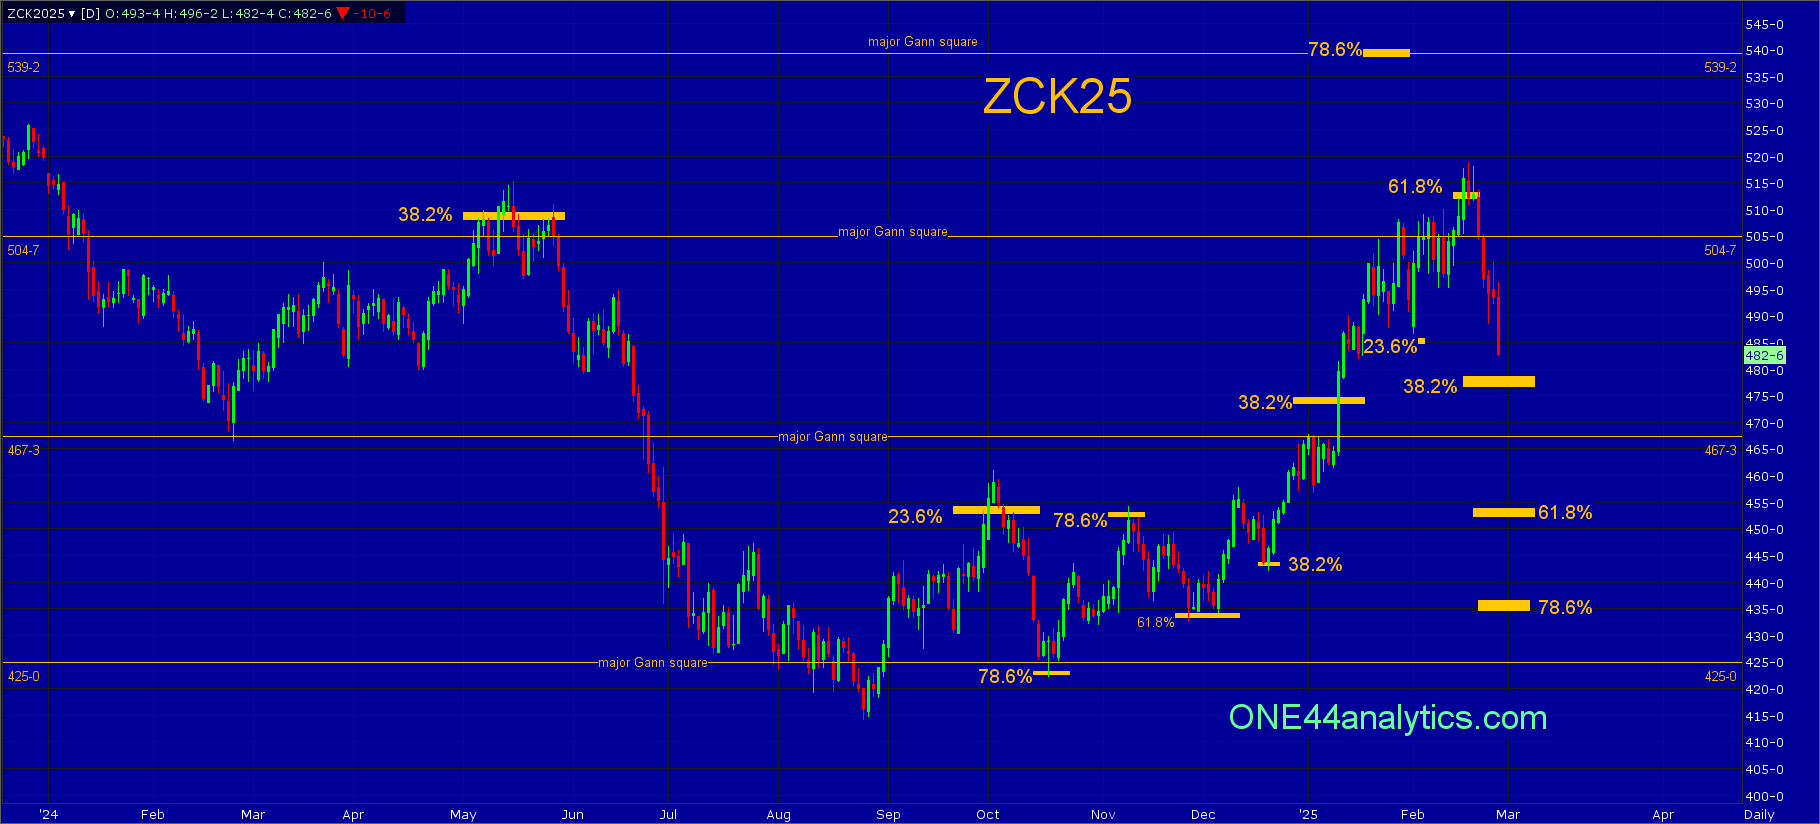
It has now hit 61.8% at 512.00, but has not moved from this level in any meaningful way and it will again be the key level for the next week. The Above remains the same and the Below has moved up some.
Use 512.00 as the swing point for the week again.
Above it, you still have to watch for a trade up to, or above 512.00 and a close below the 504.75 major Gann square, as this can cause a quick selloff. The short....
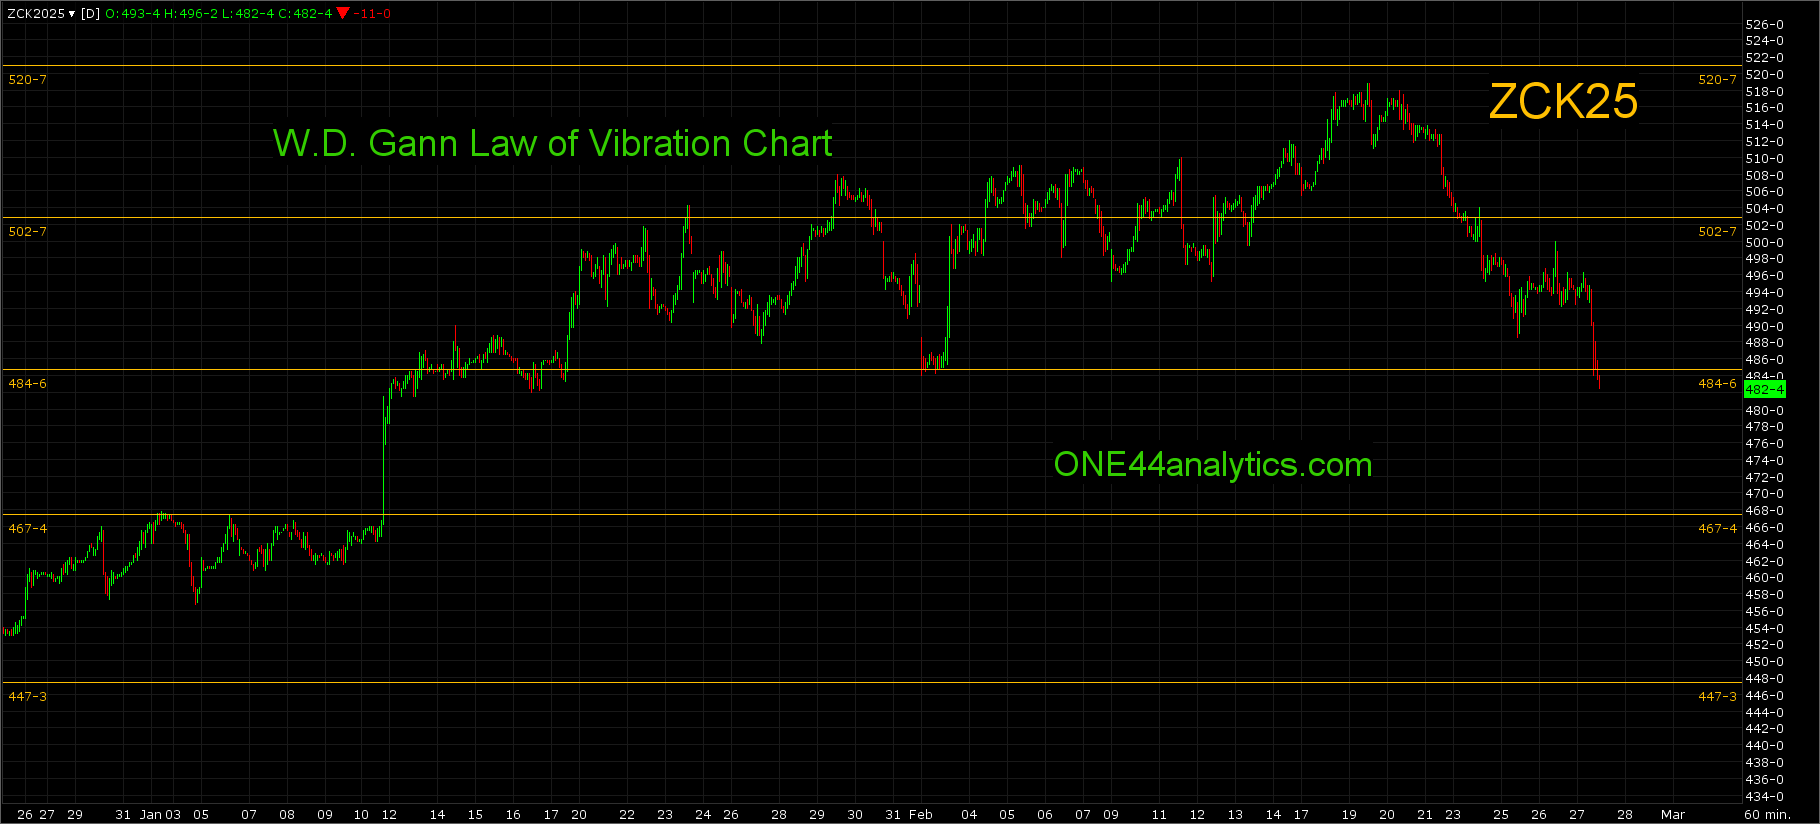
This week's break from the 512.00 swing point and 61.8% has taken it below the 504.75 major Gann square and this will be the key level for the next week. We continue to look for the long term swing point. When and if this level is hit, it will become the swing point for the week.
Use 504.75 as the swing point for the week.
Above it, the short term target is 539.25, this is 78.6% and a major Gann square. The long term target is 571.75, this 38.2% on the continuation chart and a major Gann square.
Below it, the short term target is 38.2% back to the 8/26/24 low at 478.00, this is now the long term swing point, holding it can send quickly to a new high. With it hitting the 61.8% level at 512.00 the longer term target will be 61.8% the other way at 454.00 per the ONE44 61.8% rule.
Law of Vibration chart for short term support and resistance
Wheat
| Trend | Swing Point | Target | |
|---|---|---|---|
| Long Term | 628.00 | 520.00 | |
| Intermediate Term | 590.00 | 555.00 | |
| Short Term | 590.00 | 570.00 | |
| As of: 2/27/2025, 11:33:38 AM | |||
May
From last week,
The high this week fell short of the long term swing point at 628.00. We will now watch for 38.2% back to the 1/10/25 low at 589.00, this is the level that needs to hold to keep the short term trend positive, so it will be the key level for the next week.
Use 589.00 as the swing point for the week.
Below it, the short term target is 61.8% of the same move at 570.00. The long....
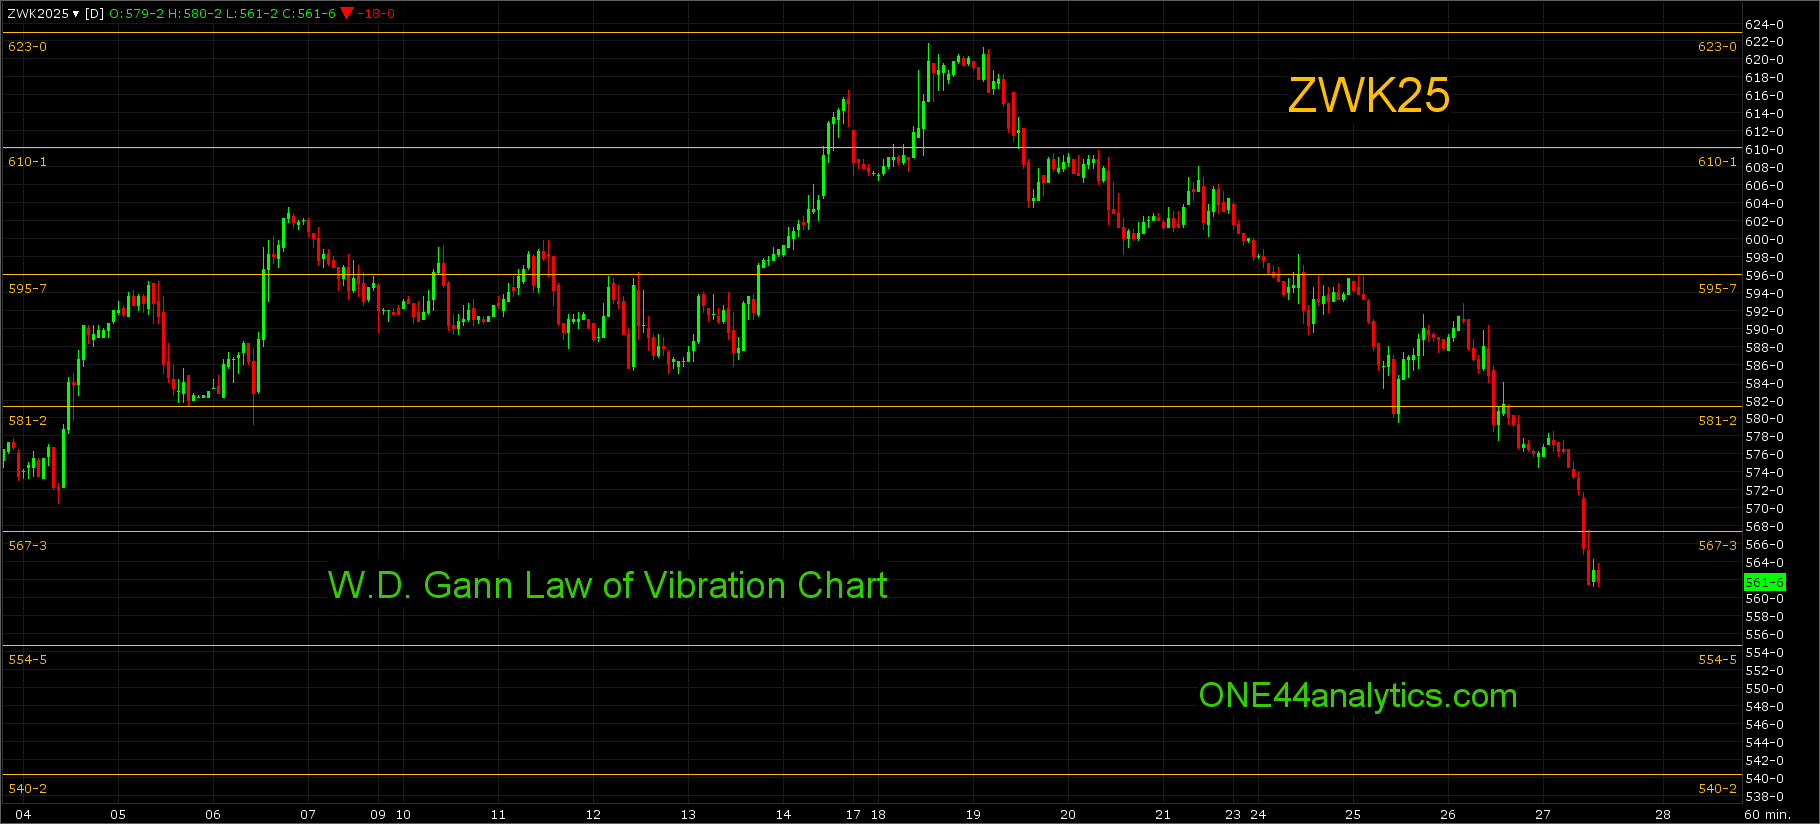
The setback after failing to get above the long term swing point at 628.00 has not taken out the short term swing point at 589.00 turning the short term negative again. It has now hit the 61.8% short term target at 570.00 and this will be the key level for the next week.
Use 570.00 as the swing point for the week.
Above it, provided they can get right back above it, with 570.00 being a 61.8% retracement we will follow the ONE44 61.8% rule to get the short term target of 61.8% the other way at 599.00. The longer term target area is 38.2% back to the contract high at 628.00 (long term swing point) and the 634.75 major Gann square. The long term target is 61.8% of the same move at 681.00.
Below it, the short term target is 78.6% of the same move at 555.00, a failure to turn higher from here will give us only major Gann squares to look for support and then use as the swing point when closed below, the next one is 522.75. Any rally that can't get back above 589.00 is a negative sign and a new low can quickly follow.
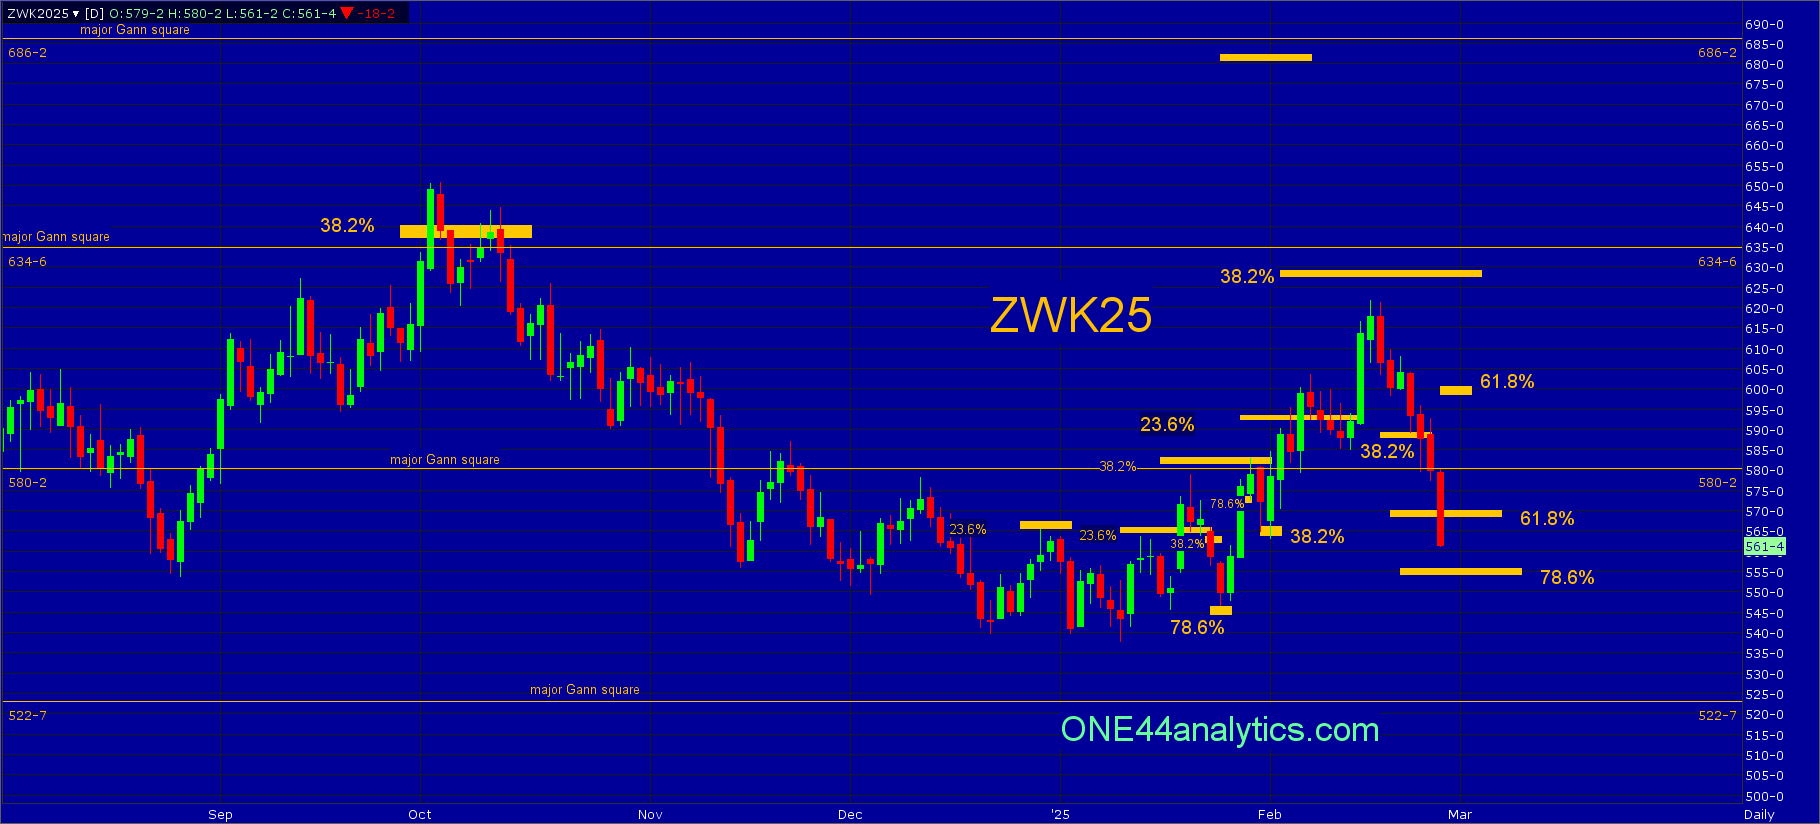
Law of Vibration chart for short term support and resistance
Livestock
Cattle
April
From last week,
It now has 4 closes below the long term swing point at 195.50 turning the trend negative. June has yet to take out their long term swing point (Special Update). This will remain the key level for the next week.
Use 195.50 as the swing point for the week again
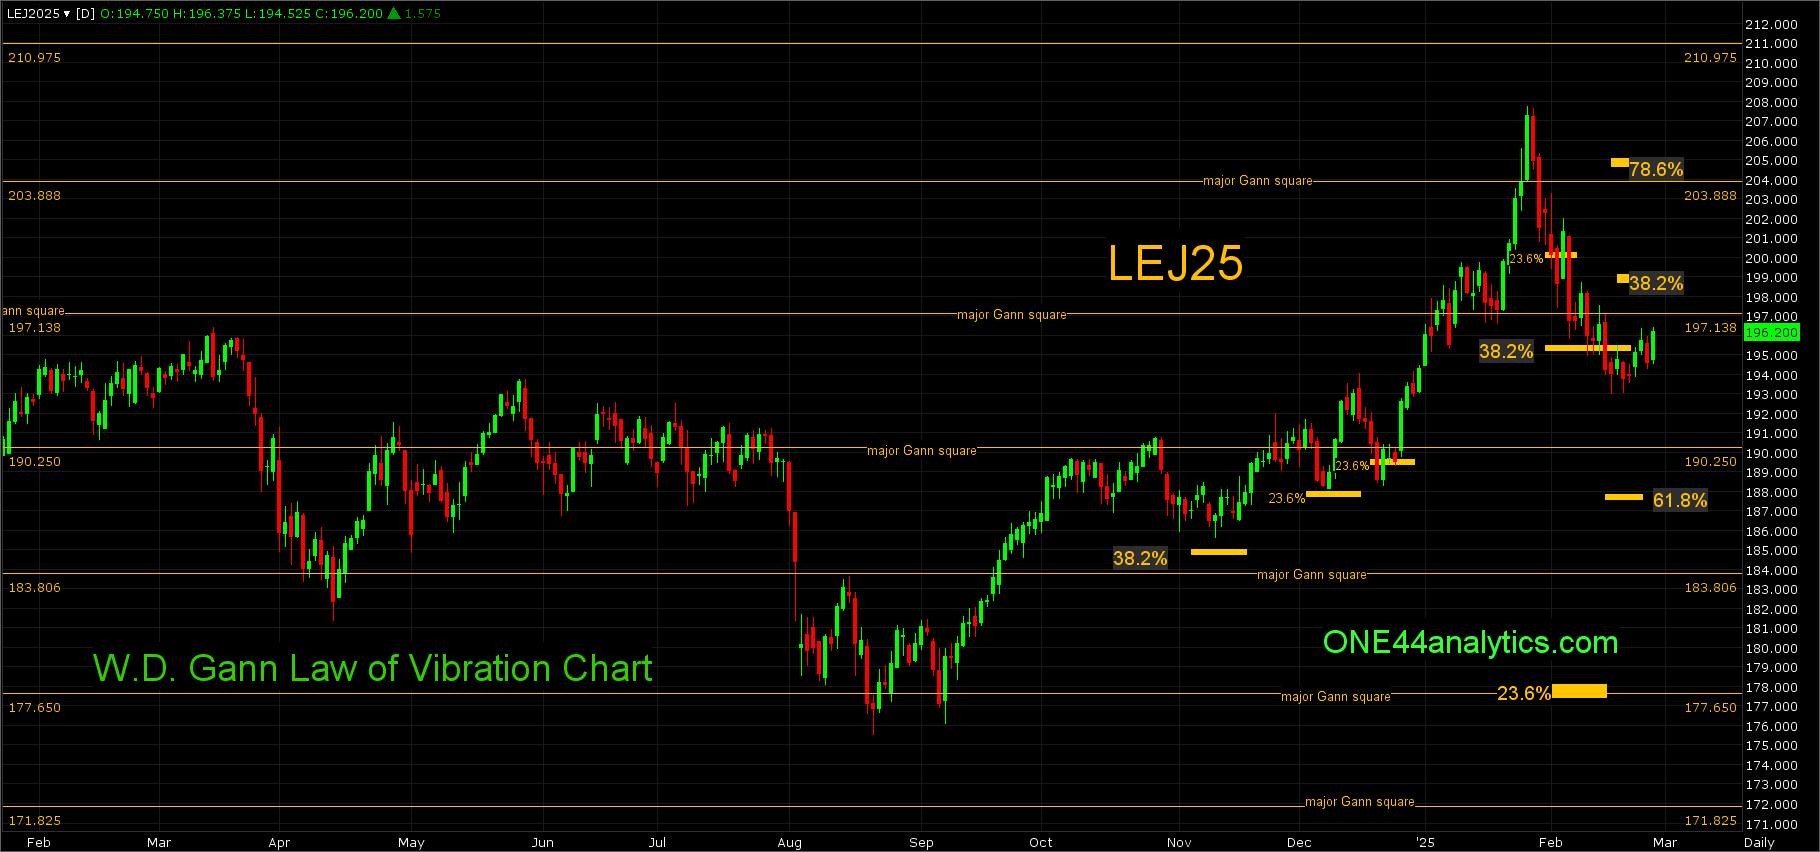
There has been no follow through with all the closes below the long term swing point at 195.50 (38.2%) and yet there is no big rally that you would expect after getting back above a key long term level. The June contract is still holding its long term swing point, but the rally has been muted so far (not a good sign). With no new low all the Above/Below remains the same for the next week.
Use 195.50 as the swing point for the week again.
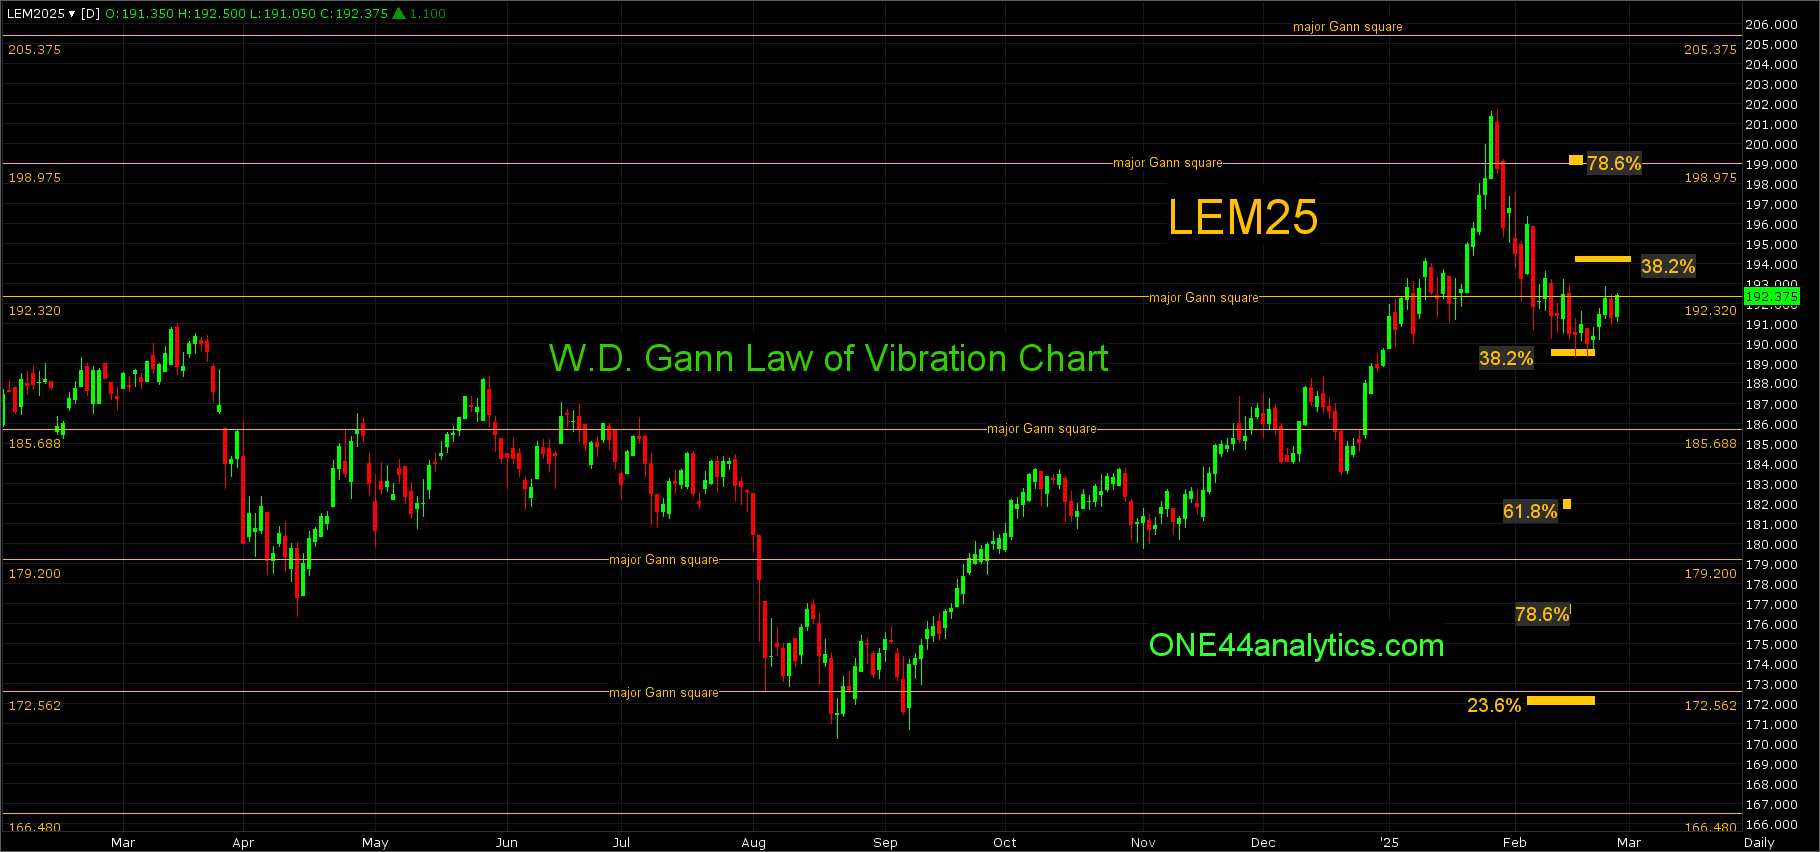
Above it, the short term target is 38.2% back to the 1/28/25 high at 198.75, a failure to get above this level after getting back above the long term swing point would be a negative sign and a new low can quickly follow. The long term target area is the 203.88 major Gann square and 78.6% of the same move at 204.70.
Below it, the short term target area is the 190.25 major Gann square and 61.8% back to the 8/21/24 low at 188.00. The long term target is 23.6% on the continuation chart at 177.65, this is also a major Gann square.
June
It has now hit 38.2% at 189.70 and this will be the key level for this week.
Use 189.70 as the swing point for the week.
June has held above the long term swing point at 189.70, but has not had much of a rally yet, this level will again be key for the next week. With no new low the Above remains the same for the next week.
Use 189.70 as the swing point for the week again.
Above it, the short term target is the 198.97 major Gann square, this is also 78.6% back to the 1/29/25 high. Any rally that can't get above 38.2% of the same move at 194.10 would be a negative sign and a new low can quickly follow.
Below it, failing to hold 189.70 turns the long term trend negative and the short term target is the 185.68 major Gann square. The longer term target is 61.8% of the same move at 182.15. The long term target is 23.6% on the continuation chart at 172.56, this is also a major Gann square.
Feeder Cattle
This will be the last update for March.
From last week,
This week also held 23.6% at 266.44 and it will again be the key level for the next week. With no new high, or low the Above/Below remain the same.
Use 266.44 as the swing point for the week again.
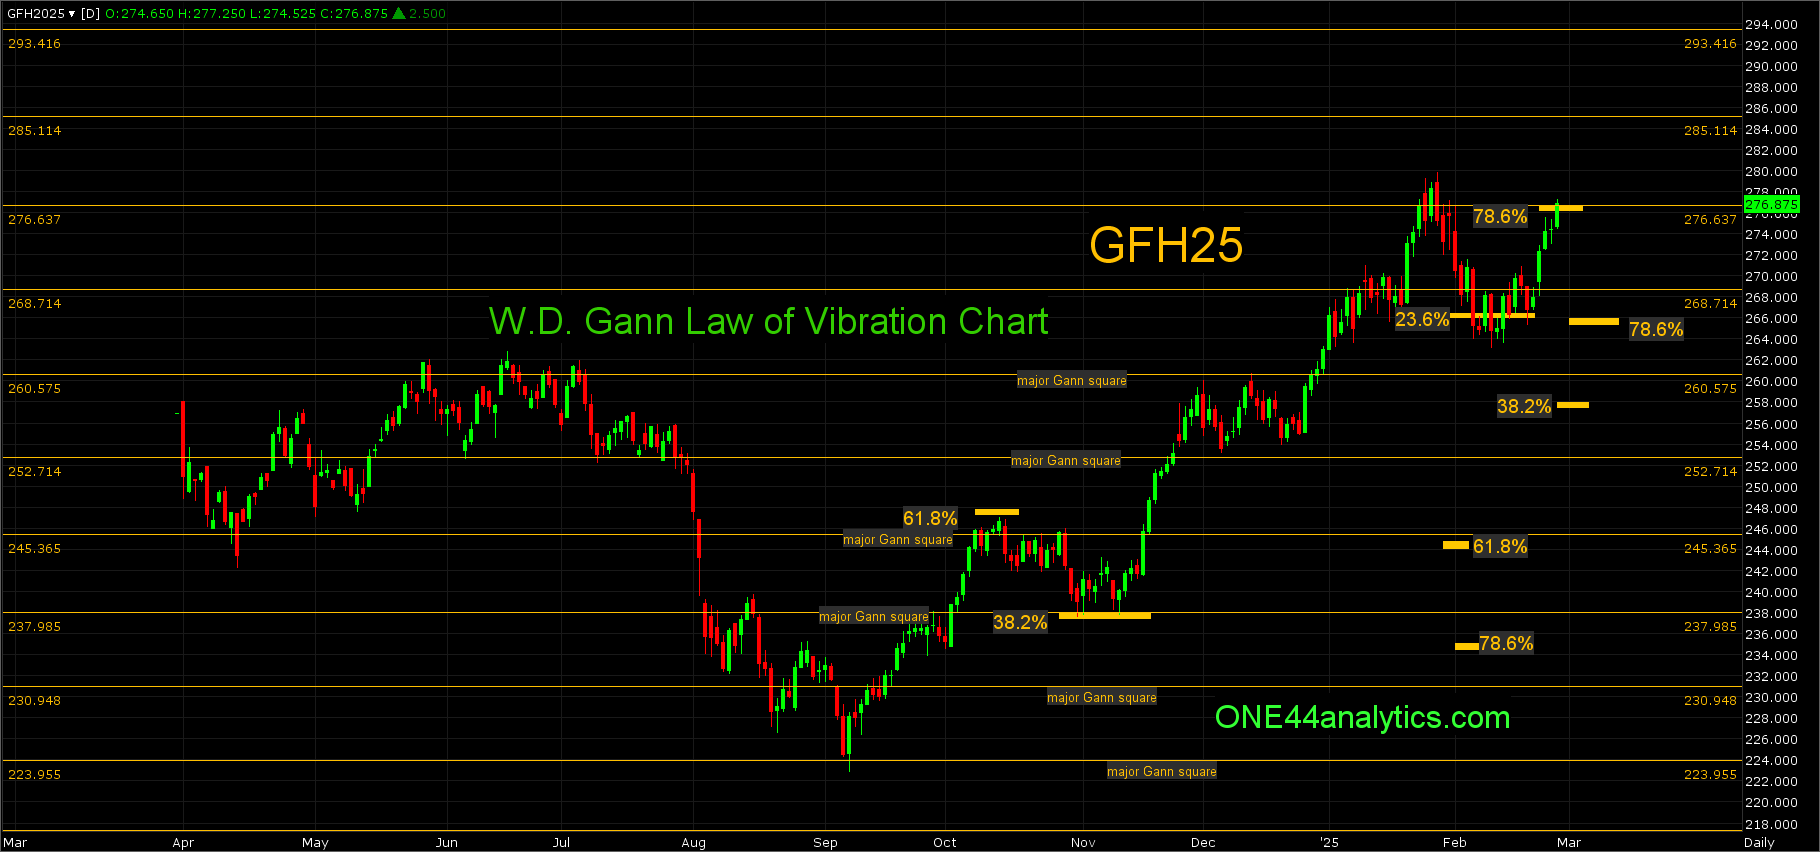
Above it, with this being 23.6%, it can send it to a new high and the 285.11 major Gann square. The short term target is 78.6% at 276.63, this is also a major Gann square. A failure to make a new high in the area of a 78.6% retracement can send this market quickly lower (ONE44 78.6% rule). Any rally...
The rally from the 266.44 (23.6%) swing point for the week is right at the short term target of 276.63, this is both a major Gann square and 78.6% back to the high and will be the key level for the next week. A failure to make a new high in this area can cause a quick selloff per the ONE44 78.6% rule.
Use 276.63 as the swing point for the week.
Above it, a failure to turn lower from this area will give us only major Gann squares to look for resistance and then use as the swing point when closed above, the next two are 285.11 and 293.41.
Below it, the short term target is 78.6% the other way at 266.00 per the ONE44 78.6% rule, this will also put it back into the longer term 23.6% level at 266.44. The longer term target is the long term swing point at 258.00, this is 38.2% back to the 9/9/24 low. A failure to hold 258.00 will give us a downside target area of the 245.36 major Gann square and 61.8% of the same move at 244.80.
April
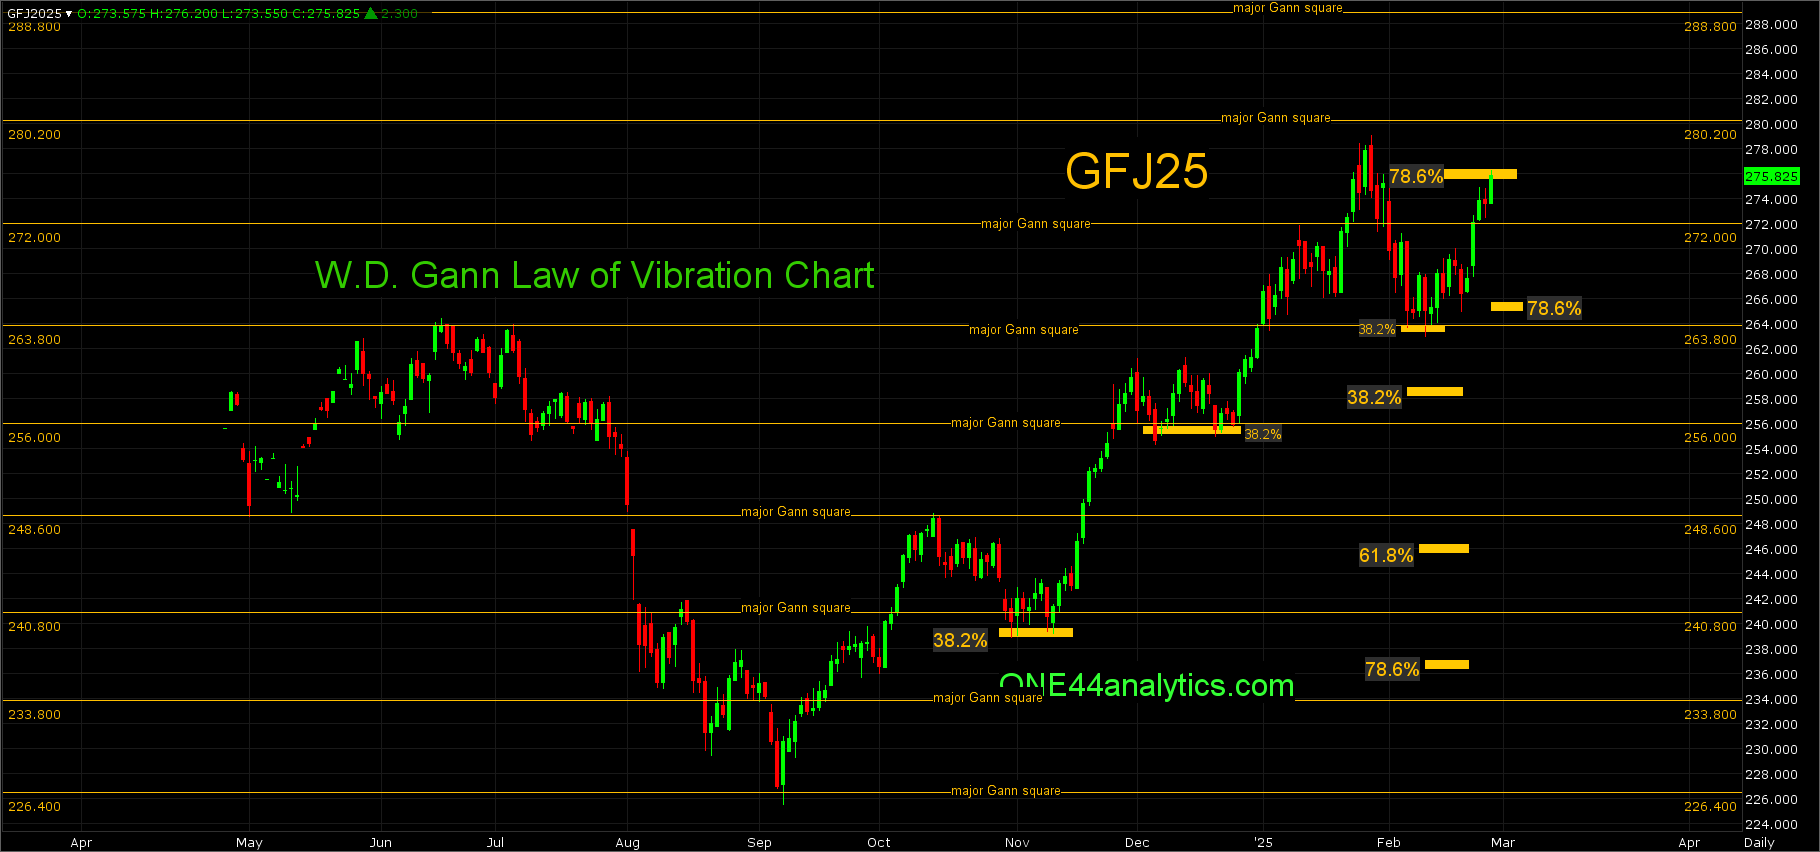
After holding the 263.80 major Gann square and 38.2% back to the 10/31/24 low, it has now hit 78.6% back to the 1/29/25 high at 275.55 and this will be the key level for next week. A failure to make a new high in the area of a 78.6% retracement can end the rally for now when following the ONE44 78.6% rule.
Use 275.55 as the swing point for the week.
Above it, a failure to turn lower from this area will give us only major Gann squares to look for resistance and then use as the swing point when closed above, the next two are 280.20 and 288.80.
Below it, the short term target is 78.6% the other way at 265.75. The long term target area is the long term swing point at 259.00 (38.2%) and the 256.00 major Gann square.
Lean Hogs
April
From last week,
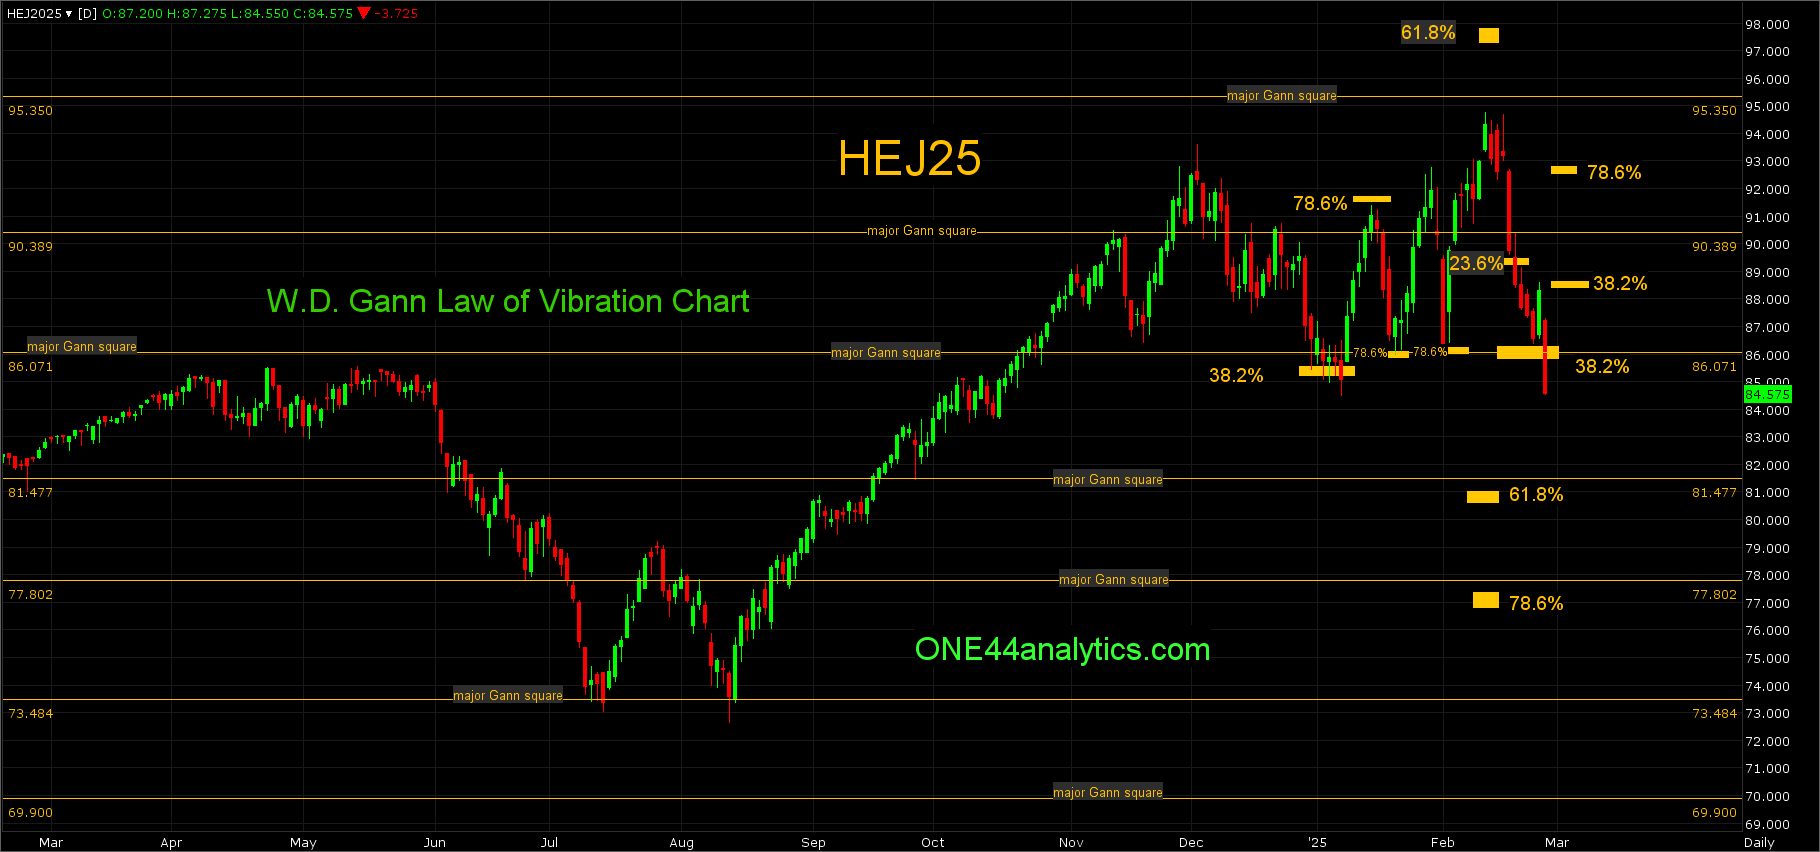
Today it closed below 23.65 at 89.60, this will be the key level for the next week.
Use 89.60 as the swing point for the week.
Below it, the short term target area is 38.2% back to the 8/13/24 low (long term swing point) at 86.40 and the 86.07 major Gann square. The long term target....
The break from the 89.60 swing point has hit the short term target area of 86.40 and 86.07, with this also being the long term swing point, 86.40 will be the key level for the next week. It can have one close below it, but the next day has to be right back above it to be good.
Use 86.40 as the swing point for the week.
Above it, getting right back above the long term swing point can send this market to a new high, the short term target is 78.6% back to the 2/12/25 high at 92.55. Any rally that can't get above 38.2% of the same move at 88.40 is a negative sign and a new low can quickly follow.
Below it, turns the long term negative and the short term target area is the 81.47 major Gann square and 61.8% at 81.10. The long term target is 78.6% of the same move at 77.45.