Wheat Outlook
ONE44 Analytics where the analysis is concise and to the point
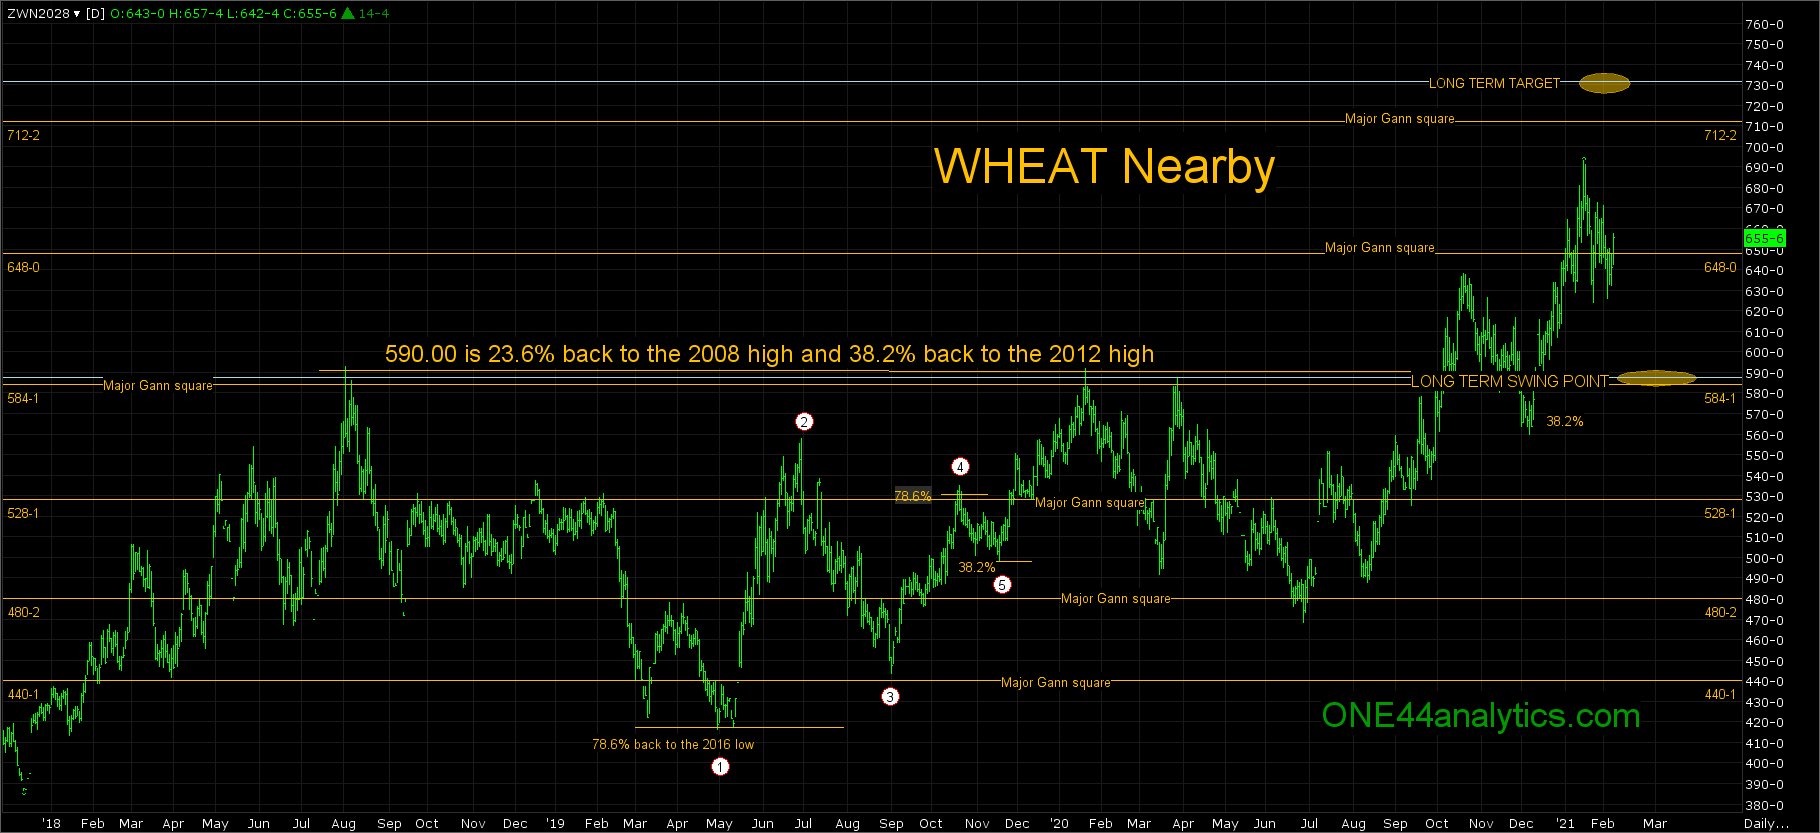
WHEAT
Wheat remains in a very strong position, however it has been trading back and forth through the 648.00 major Gann square. You can use this as the short term swing point, as long as it can continue to close above it look for our long term target of 731.00, this is 38.2% back to the all-time high. One other level to look for resistance before there is the 712.25 major Gann square. With a solid close below 648.00 look for the long term swing point at 590.00, this is 38.2% back to the 2019 low. It should also find support there because of the 584.00 major Gann square and it puts it back on top of the 2018 and 2020 highs, that were 23.6% back to the ATH and 38.2% back to the 2012 high. This is also the level that needs to hold to keep the long term view that this is going to be a multi year move higher. We have had this view since the fall of 2020.
The second Chart below are natural support and resistance levels that are based on W.D.Gann's "Law of Vibration".Each level can be used as support and then resistance once taken out and the reverse when starting as resistance.
These levels will be good until the end of each contract.
Our goal is to not only give you actionable information, but to help you understand why we think this is happening based on pure price analysis with Fibonacci retracements and Gann squares.
You can get all the rules and guidelines to the Fibonacci retracements on our website
Sign up for our Free newsletter here.
This is our latest video in an ongoing series of how to use the Fibonacci retracements. Even if you do not trade the market covered the rules and guidelines are the same, as we believe the Fibonacci retracements are the underlying structure of all markets.
https://www.youtube.com/watch?v=gSISbkEtQj0&t=143s&ab_channel=ONE44Analytics