Wheat Top 952.00?

ONE44 Analytics where the analysis is concise and to the point
Our goal is to not only give you actionable information, but to help you understand why we think this is happening based on pure price analysis with Fibonacci retracements, that we believe are the underlying structure of all markets and Gann squares.
Wheat
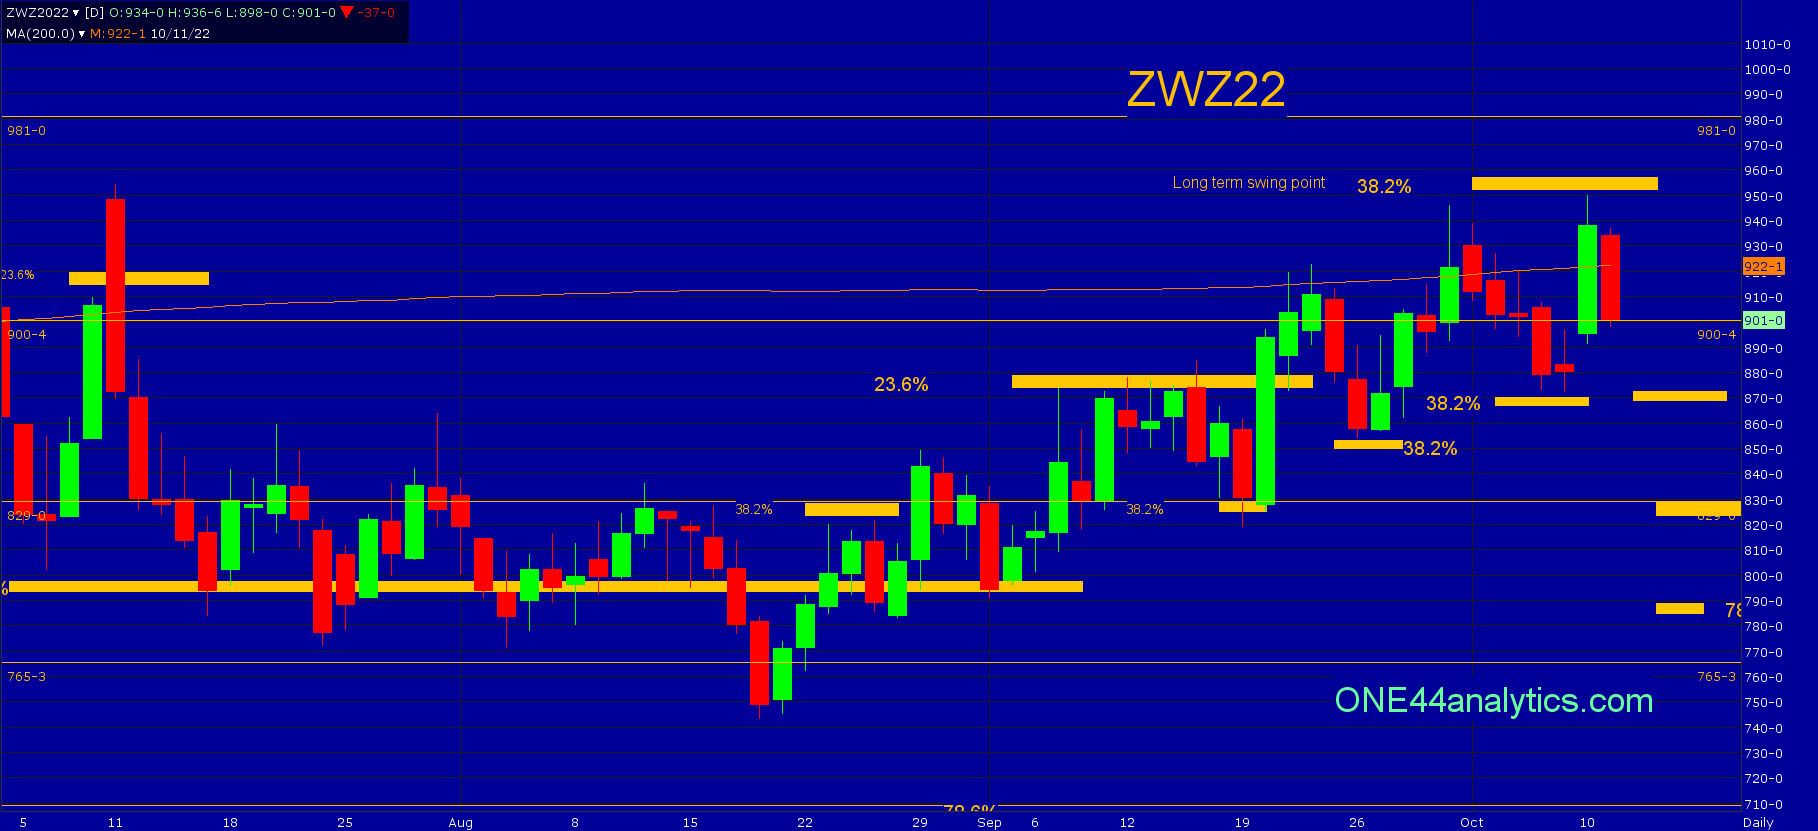
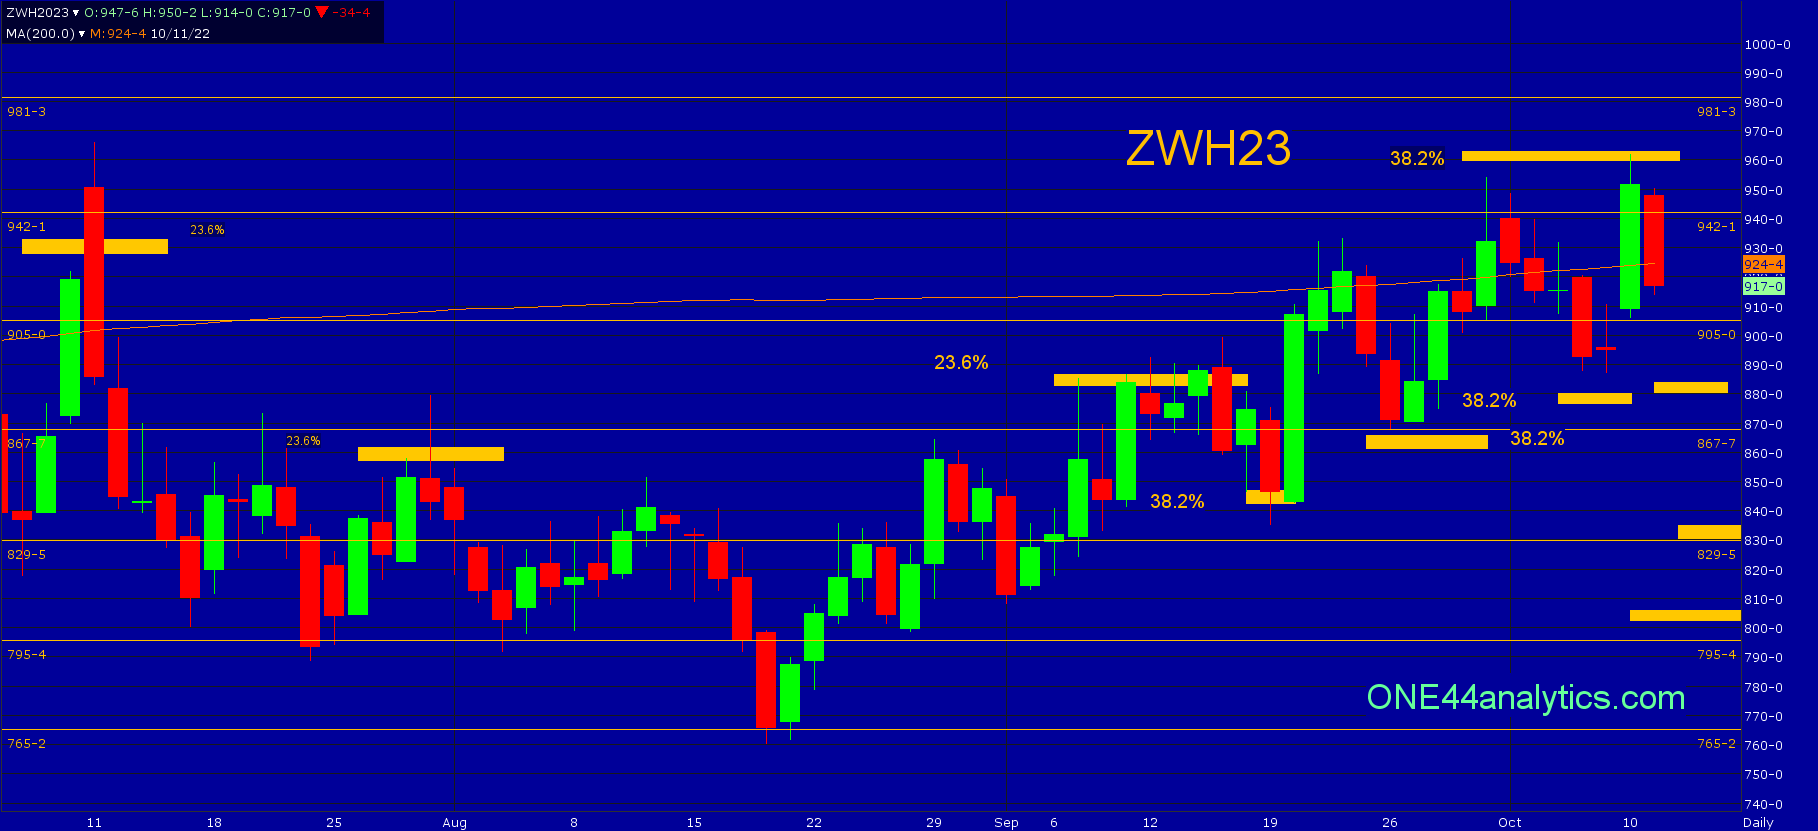
Short story is, December Wheat fell 2 cents short of our long term swing point at 952.00. In the March contract it hit it at 960.00. These levels are 38.2% of the contract highs and lows and a break from this area can send to new lows for the year, this is the long term target. As always we watch all the retracements on every move to see just how weak, or strong the market is regardless of the longer term target. Provided they didn't turn lower from here and took out 952.00 we would have to go to the ONE44 38.2% rule to get the target above.
The long story is, you have to follow what we were saying in previous posts and what levels needed to hold to keep the rally going.
From our Weekly update on 9/16/22 we said,
We will start the week with the 829.00 major Gann square as the swing point again.
Monday traded below 829.00 and closed back above it, this was also 38.2% of the rally and we were looking for new highs from it. That happened the next day.
In the 9/25/22 post we said,
We will start the week using 900.50 as the swing point. Above it, we are still looking for the long term swing point at 952.00, this is 38.2% of the 8/18/22 low and the contract high. This is the level that needs to be taken out to get all 3 trends positive.
The current rally continues to make higher highs and higher lows, always a good sign and on any setback from 900.50 we would want to see it hold 38.2% at 852.00. Provided it can, the short term trend remains positive and you can look for new highs for this leg up.
As you can see on the chart the low on the 26th was 854.25 and it took it to just short of the long term swing point of 952.00.
In the 10/9/22 post we said,
Use 869.00 as the swing point to start the week.
Holding 869.00 (38.2%) should send it right back up to the highs again and then the long term swing point at 952.00.
Once again the trend was kept positive by staying above a 38.2% retracement. Monday's explosive rally fell 2 cents short of the 952.00 long term swing point and in the March contract it hit it. We will now watch the short term retracements to see just how weak, or strong this market is. If you like this type of analysis and want to know these levels ahead of time and where we think it is going now, you can become a Premium Member.
FULL RISK DISCLOSURE: Futures trading contains substantial risk and is not for every investor. An investor could potentially lose all or more than the initial investment. Commission Rule 4.41(b)(1)(I) hypothetical or simulated performance results have certain inherent limitations. Unlike an actual performance record, simulated results do not represent actual trading. Also, since the trades have not actually been executed, the results may have under- or over-compensated for the impact, if any, of certain market factors, such as lack of liquidity. Simulated trading programs in general are also subject to the fact that they are designed with the benefit of hindsight. No representation is being made that any account will or is likely to achieve profits or losses similar to those shown. Past performance is not necessarily indicative of future results.