Wheat update
ONE44 Analytics where the analysis is concise and to the point
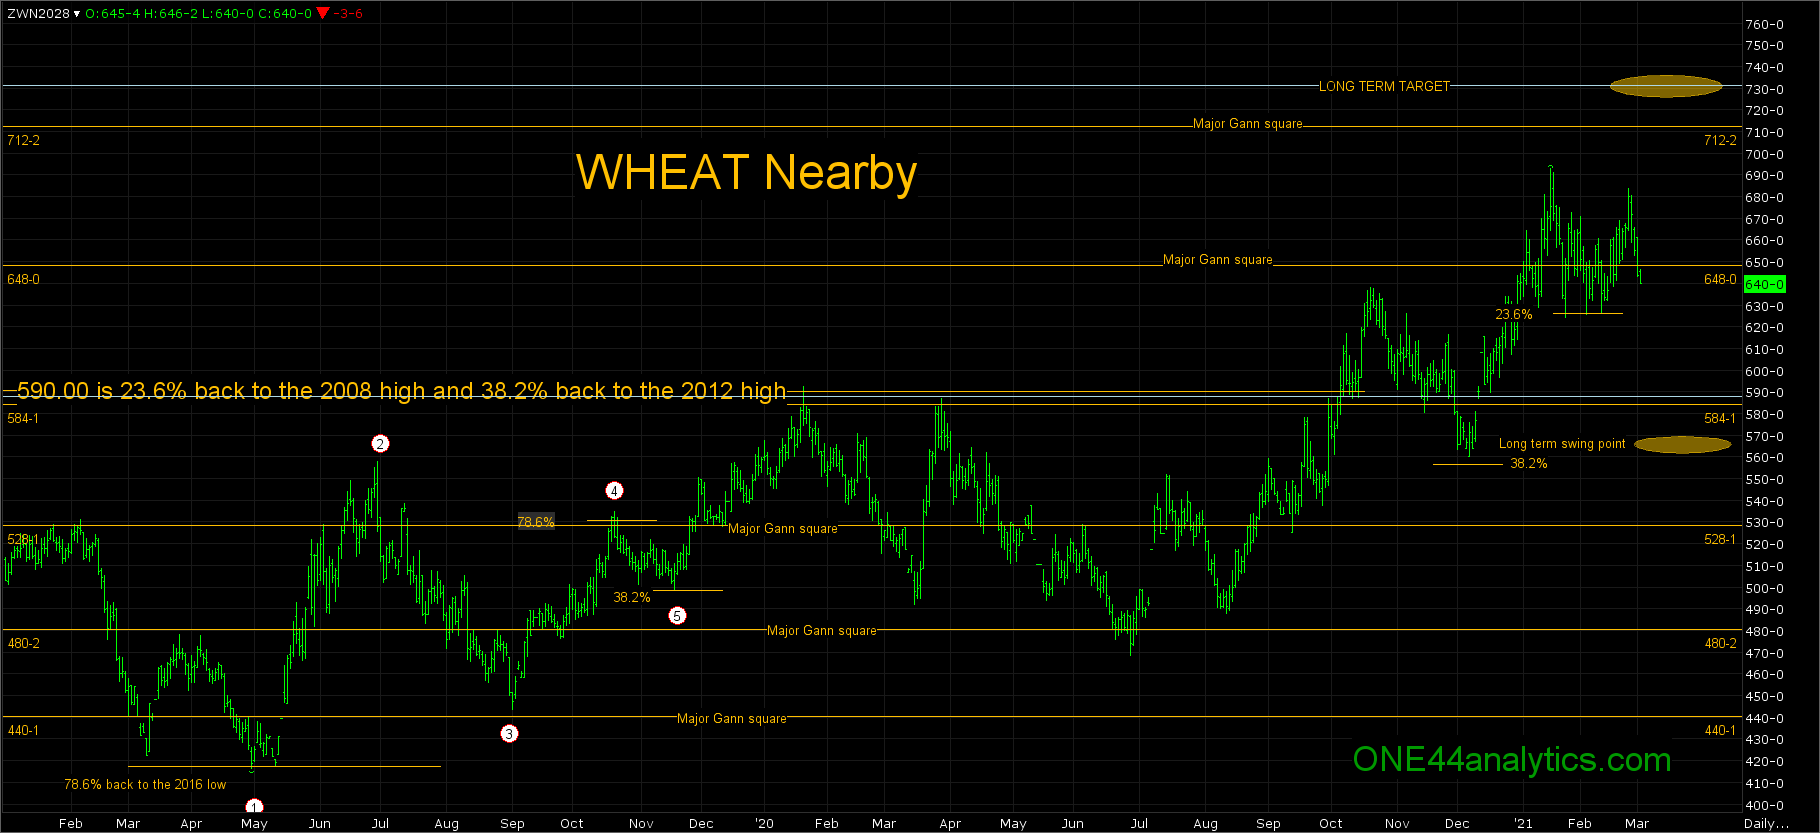
WHEAT
Our long term target remains 731.00, this is 38.2% back to the all-time high. The long term swing point to keep our idea that this is going to be a multi year rally alive, is 565.00.
The trade around the 648.00 major Gann square has been very choppy. The rallies above it have failed to make new highs and the trade below it has held 626.00, this is 23.6% back to the 2019 low. The fact that it continues to hold this keeps the market extremely strong. You can use this as the short term swing point. They can trade below it, but would have to close back above it to remain extremely positive. Provided this did happen, once they get back above the 648.00 major Gann square they should go for new highs and then the long term target of 731.00.
With a solid close below 626.00 look for 585.00, this is 38.2% back to the 2019 low. It would also put back at the 584.00 major Gann square and on top of the 2018 and 2020 highs, that were 23.6% back to the ATH and 38.2% back to the 2012 high.
It would have to take out 565.00, our long term swing point to put the idea of a multi year rally that we have been mentioning since last fall on hold.
The second Chart below are natural support and resistance levels that are based on W.D.Gann's "Law of Vibration".Each level can be used as support and then resistance once taken out and the reverse when starting as resistance.
These levels will be good until the end of each contract.
Our goal is to not only give you actionable information, but to help you understand why we think this is happening based on pure price analysis with Fibonacci retracements and Gann squares.
You can get all the rules and guidelines to the Fibonacci retracements on our website
Sign up for our Free newsletter here.