Why ONE44

What do Grains, Stocks, Bonds and Cryptocurrencies all have in common?
ONE44 Analytics where the analysis is concise and to the point
You may think nothing, however if you take off the ticker symbol on the chart, you end up with nothing but numbers that adhere to what we believe is the underlying structure of all markets, Fibonacci Retracements.
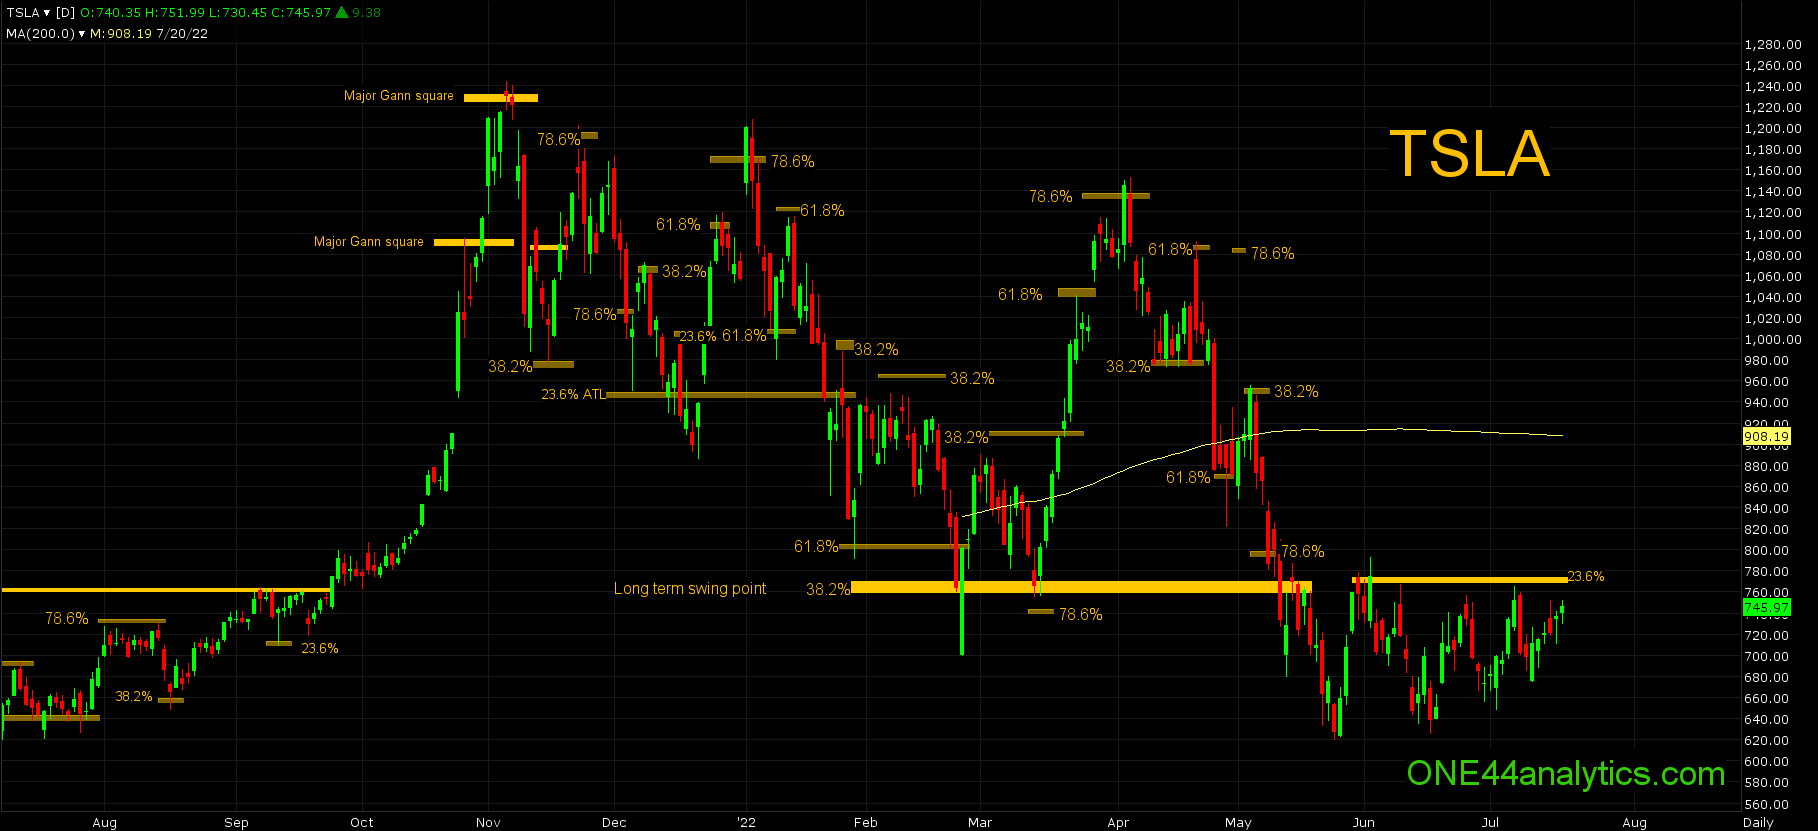
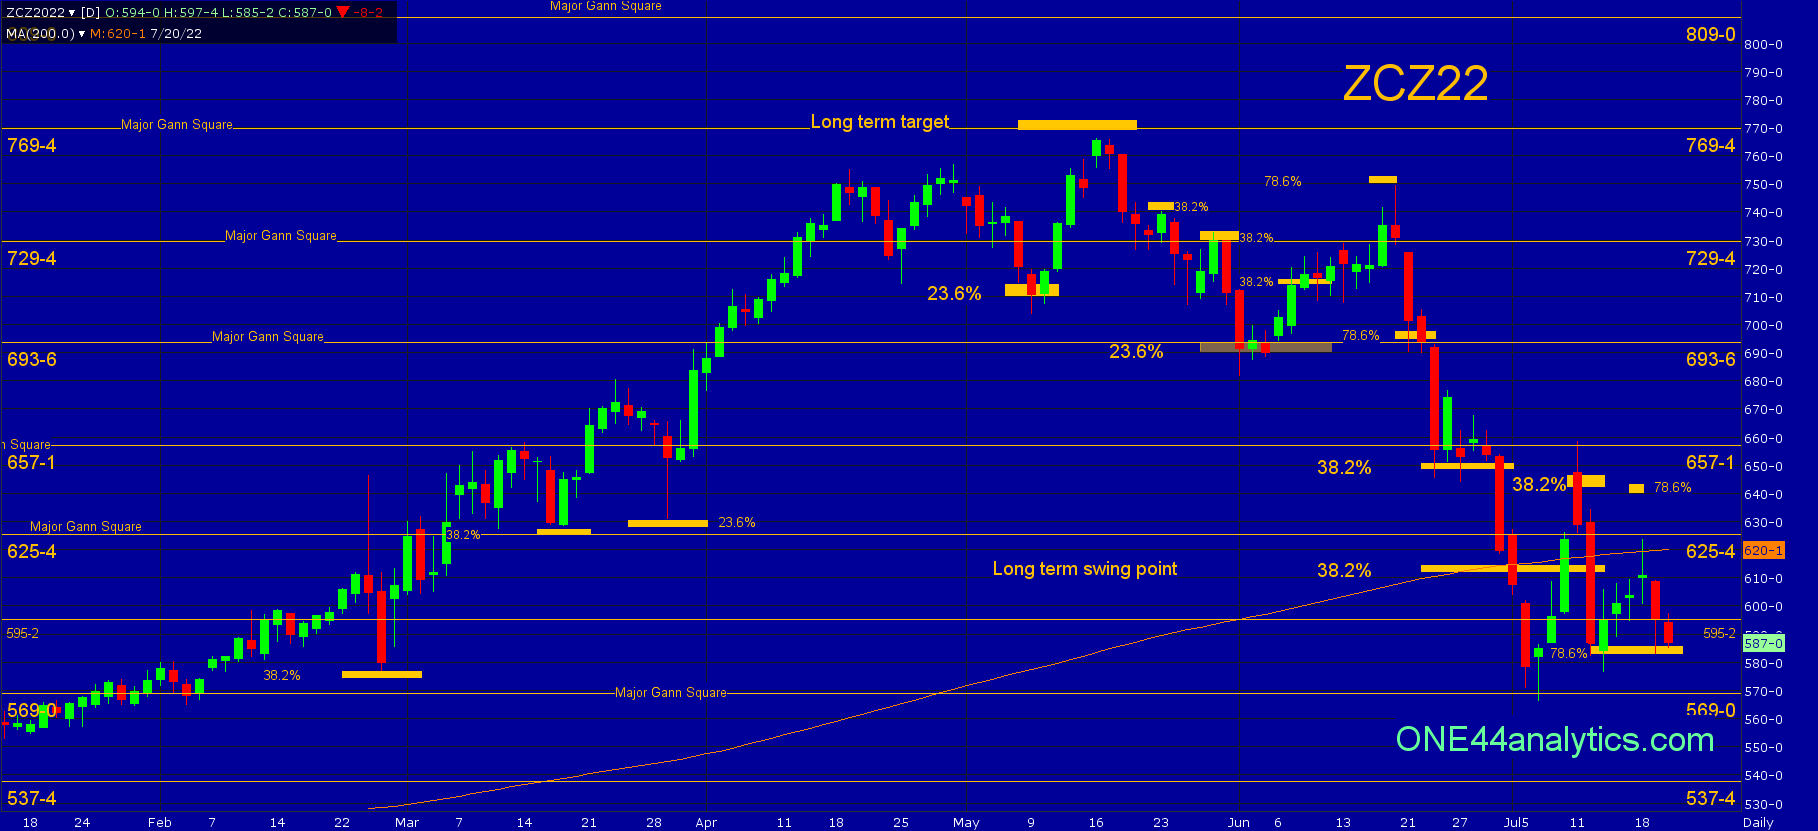
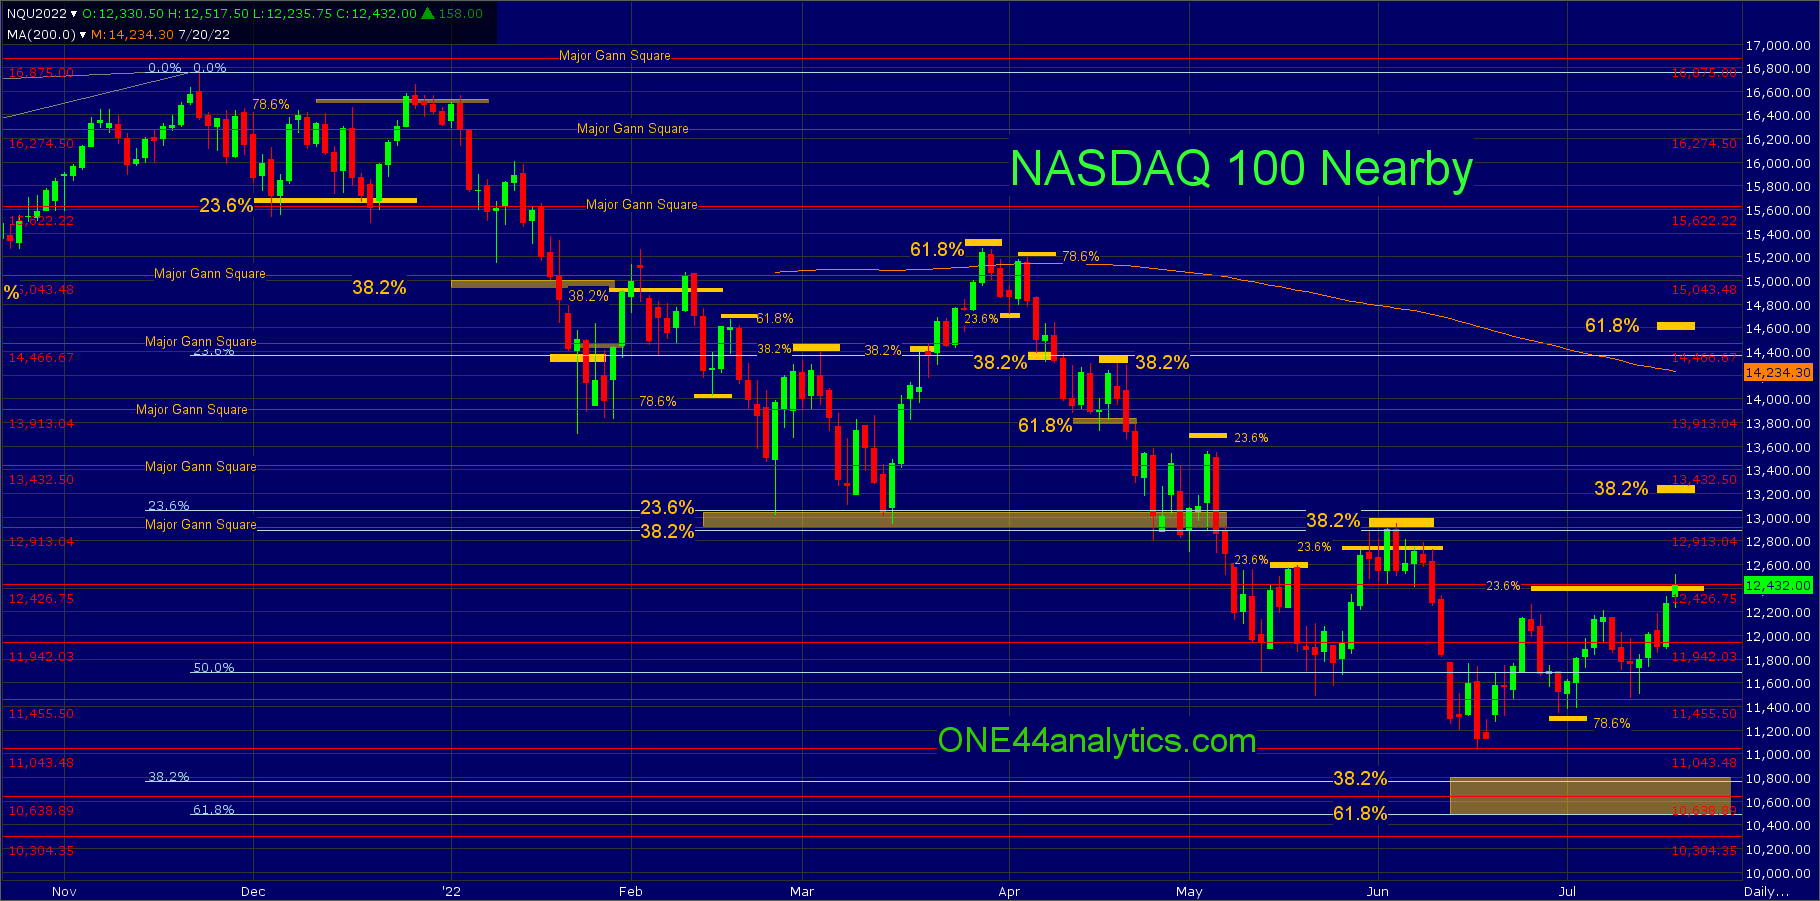
When using the Fibonacci retracements with the ONE44 rules and guidelines you get a better understanding of the trend and the strength of it, as well as when it is telling you it is about to change. It comes down to 4 levels to watch, 23.6%, 38.2%, 61.8% and 78.6%. There will be trends within trends, as no market goes one way forever and this is why we always say " we will watch all the retracements on every move to see how weak, or strong it is regardless of the longer term target".
When following the ONE44 rules and guidelines, we know that extremely strong, or weak markets will only retrace 23.6% and that to hold the current trend it must stay above/below 38.2%. A 61.8% retracement can send it 61.8% the other way and 78.6% should send it 78.6% the other way and even end the move completely. When these levels are hit you will get targets to look for and when they fail to complete the target, they tell you just as much as to what is possible next. This is one of the two main methods we use in our Grain Weekly update for our Premium Members. The other is based on the W.D. Gann Law of Vibration.
By looking at the charts below you can see how important it is to know where these levels are and what is possible when they are hit. From one of the wildest stocks in Tesla to the NASDAQ futures and December Corn, all so different yet adhering to the same ONE44 Fibonacci rules and guidelines. If you trade Grains you can become a Premium Member and get all the levels and analysis ahead of time and if you don't there is plenty on the website to learn more about how to use these levels from previous posts and over a dozen YouTube videos. As we tell our subscribers, "we want you to understand why we think what we think", as it makes for a better experience.
FULL RISK DISCLOSURE: Futures trading contains substantial risk and is not for every investor. An investor could potentially lose all or more than the initial investment. Commission Rule 4.41(b)(1)(I) hypothetical or simulated performance results have certain inherent limitations. Unlike an actual performance record, simulated results do not represent actual trading. Also, since the trades have not actually been executed, the results may have under- or over-compensated for the impact, if any, of certain market factors, such as lack of liquidity. Simulated trading programs in general are also subject to the fact that they are designed with the benefit of hindsight. No representation is being made that any account will or is likely to achieve profits or losses similar to those shown. Past performance is not necessarily indicative of future results.