Bitcoin Analysis with Fibonacci

We are adding Bitcoin to the new free updates with Gold, Crude Oil and SP 500.
You can use this link to get on the email list.
Bitcoin
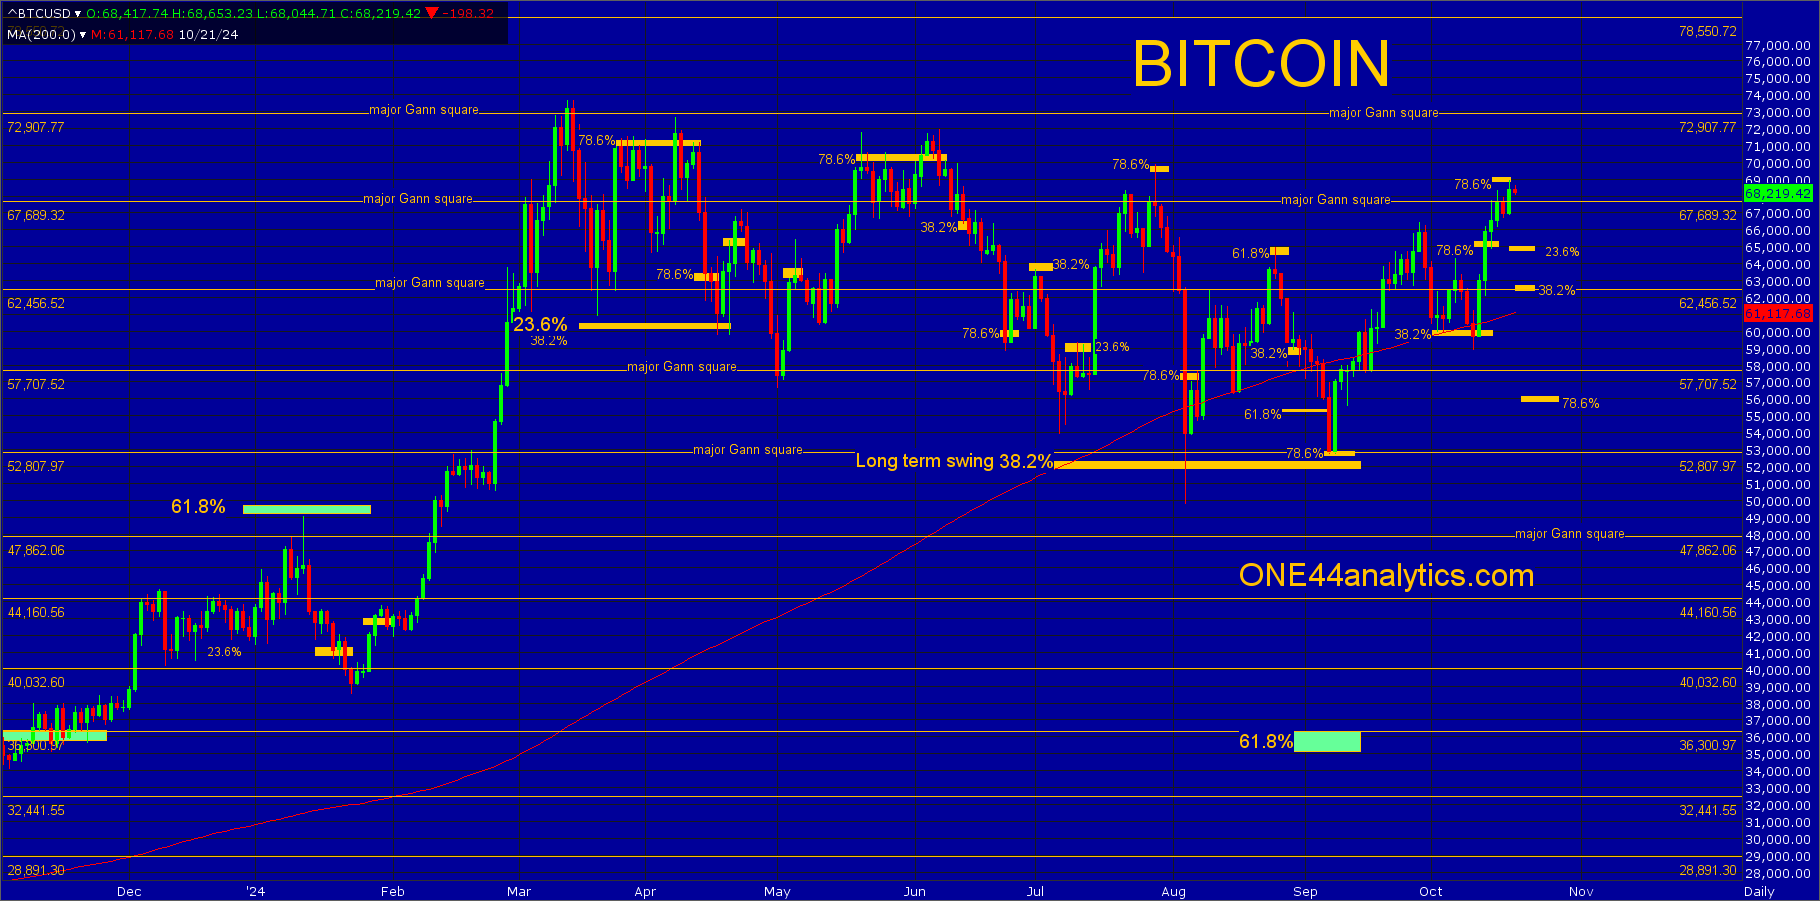
The chart is key to this analysis.
There are two methods we use at ONE44 to find support and resistance in the markets.
The first are major Gann squares, these are the yellow horizontal lines on the chart. On the chart you can see where the market turned multiple times at these levels.
The second is Fibonacci retracements and this is what most of this post will be about.
There are a few basic rules when using the Fibonacci retracements with the ONE44 rules and guidelines.
This is the short version.
A 38.2% level keeps the trend intact and new highs/lows should follow.
A 23.6% level shows the market is extremely strong, or weak.
A 61.8% level can cause wide swings and keep the market in a trading range.
A 78.6% level can send it 78.6% of where it just came from and even be the end or start of a Bull market.
We have done 43 videos on how to use the Fibonacci retracements with the ONE44 rules and guidelines. These Videos are worth watching even if it is not in the market you are trading, as the ONE44 rules and guidelines are the same for every market. You will also see why we believe the Fibonacci retracements are the underlying structure of ALL markets.
…….
10/19/24
From last week,
This week's low held 38.2% at 60,000, this keeps the current leg positive.
Use 60,000 as the DSP for the week.
The short term target above is, 78.6% back to the 9/27/24 high at 65,100. The long term target is 78.6% at 68,900
While this market has been in a large sideways trade since the March high, it has held the long term swing point at 52,000 (38.2%) in August and then again in September. The recent setback this month held 38.2% back to the August low at 60,000 and it has now hit the long term target of 78.6% at 68,900. As you can see on the chart the 3 of the last 4 highs came at a 78.6% retracement (April, June, July) and this is where we are right now at 68,900.
Use 68,900 as the swing point for the week.
Above it, With the amount of sideways trade the next move higher could be an explosive one. It will first have to take out the 72,907 major Gann square and ATH high at 73,662. When and if it does the long term target is 96,115, until then there are only major Gann squares above to look for resistance and then use as the swing point when closed above, the next two are 78,550 and 84,074.
Below it, the long term target is 78.6% the other way at 56,200 based on the ONE44 78.6% rule. The short term target is 38.2% at 62,456, this is also a major Gann square. Any setback that holds 23.6% at 65,150 is extremely positive and new highs can quickly follow.
You can also see on the chart how many times the market found support and resistance at the major Gann squares (yellow horizontal lines).
ONE44 Analytics where the analysis is concise and to the point
Our goal is to not only give you actionable information, but to help you understand why we think this is happening based on pure price analysis with Fibonacci retracements, that we believe are the underlying structure of all markets and Gann squares.
If you like this type of analysis and trade the Grain/Livestock futures you can become a Premium Member.
You can also follow us on YouTube for more examples of how to use the Fibonacci retracements with the ONE44 rules and guidelines.
FULL RISK DISCLOSURE: Futures trading contains substantial risk and is not for every investor. An investor could potentially lose all or more than the initial investment. Commission Rule 4.41(b)(1)(I) hypothetical or simulated performance results have certain inherent limitations. Unlike an actual performance record, simulated results do not represent actual trading. Also, since the trades have not actually been executed, the results may have under- or over-compensated for the impact, if any, of certain market factors, such as lack of liquidity. Simulated trading programs in general are also subject to the fact that they are designed with the benefit of hindsight. No representation is being made that any account will or is likely to achieve profits or losses similar to those shown. Past performance is not necessarily indicative of future results.