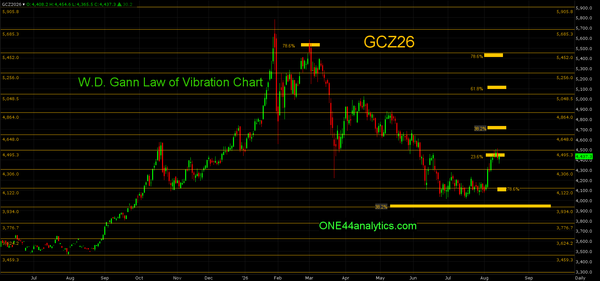
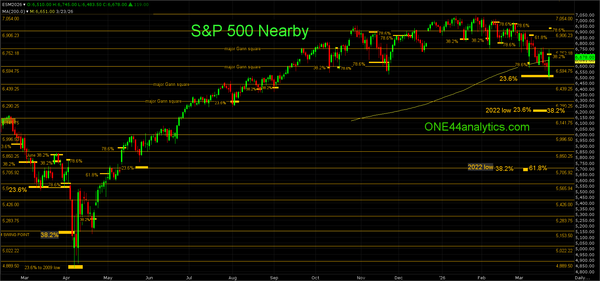
educational Gold & SP 500 Futures Update We hope you have viewed the latest video on how to find the long term retracements as these are key levels in this week's update. Gold GCZ26 From the last update, The rally that started after holding above the long term 38.2% retracement at 3934.00 has
educational ONE44 Analytics, How To Find The Long Term Fibonacci Retracements, New Video In this video we show you how to get the longer term Fibonacci retracements even when the current contract is at its ATH. The way we find key long term Fibonacci retracements is to go to the Continuation chart for the current contract that you are analyzing. This was something
educational Gold & SP 500 Futures Update 8/25/26 Gold & SP 500 Futures Update Gold GCZ26 From the last update, Gold is now trading in the December contract and like August it has held above 38.2% based on its continuation chart keeping the longer term trend positive. This level is 3934.00 and it is also a
educational Gold & SP 500 Futures Update 8/16/26 Gold & SP 500 Futures Gold GCZ26 Gold is now trading in the December contract and like August it has held above 38.2% based on its continuation chart keeping the longer term trend positive. This level is 3934.00 and it is also a major Gann square. After sitting
educational Gold & SP 500 Futures Update 7/29/26 Gold & SP 500 Futures Update All of the key levels remain the same from the last update as it trades sideways above the long term 38.2% Fibonacci retracement. Gold GCQ26 From the last update, The rally from the 4118.50 major Gann square could not get above 23.
educational Gold & SP 500 Futures Update 7/12/26 Gold & SP 500 Futures Update Gold GCQ26 From the last update, The rally from the 4118.50 major Gann square could not get above 23.6% at 4426.00 and it quickly made a new low keeping the trend very negative. The new low held above the 38.2%
educational Gold & SP 500 Futures 6/28/26 Gold GCQ26 From the last update, The market failed to turn higher at the 78.6% retracement of 4300.50 and made a new low for the move. It held the 4118.50 major Gann square and the rally from it is currently back above 78.6% and the 4300.
educational Gold & SP 500 Futures Gold GCQ26 From last week, The rally from a 61.8% retracement on 5/28/26 failed to get above 38.2% level at 4607.00 and that kept the short term trend negative. This is why we watch all the retracements on every move to see just how strong,
educational Gold, SP 500 Futures & High Flying Stocks 6/7/26 NVDA, AMZN, INTC & The 78.6% Retracement Is Below. Gold GCQ26 From last week, The top month is now August and we will pick up the analysis from the most recent key levels. The low this week traded below the 4481.60 major Gann square and hit 61.8%
educational Gold, SP 500 Futures & High Flying Stocks Gold GCQ26 The top month is now August and we will pick up the analysis from the most recent key levels.The low this week traded below the 4481.60 major Gann square and hit 61.8% of the 3/23/26 low and 4/17/26 high at 4454.
educational Gold & SP 500 Futures Analysis Gold & SP 500 Futures Analysis (GCM26) GOLD All of the Above/Below targets remain the same as well as the swing point for the week once again. GCM26 From the 4/19/26 Update, Monday's lower opening held above 38.2% back to the 3/23/26
educational Gold & SP 500 Futures Update 5/10/26 Gold All of the Above/Below targets remain the same as well as the swing point for the week. GCM26 From the 4/19/26 Update, Monday's lower opening held above 38.2% back to the 3/23/26 low at 4607.00 keeping the trend extremely positive
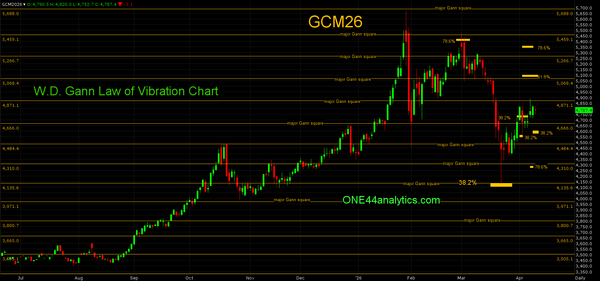
educational Gold & SP 500 Futures Update 5/3/26 Gold GCM26 From the 4/19/26 Update, Monday's lower opening held above 38.2% back to the 3/23/26 low at 4607.00 keeping the trend extremely positive and it closed above the 4722.00 swing point for the week and then went on to make
educational SP 500 Futures & Gold Analysis 4/19/26 There are two methods we use at ONE44 to find support and resistance in the markets. The first are major Gann squares, these are the yellow horizontal lines on the chart. The second is Fibonacci retracements. SP 500 Futures & Gold Analysis SP 500 Futures ESM26 From last week, The
educational SP 500 Futures & Gold Analysis SP 500 Futures ESM26 From the last update, The rally from 23.6% at 6520.00 could not get a close above 38.2% at 6700.00, or the 200 day average keeping this leg down negative and it went on to a new low as this is the target
educational Gold & SP 500 Futures, Part 2 Here is what I do know and what I don't know. Starting with what I don't know, If you ever read any analysis that is fundamental in nature in a ONE44 Analytics Update stop reading and go somewhere else for that. I have never followed the
educational SP 500 Futures & Gold Analysis 3/8/26 The charts as always are key to this analysis. GOLD GCJ26 Gold has continued to hold the 38.2% retracement on all the setbacks keeping the trend positive. ONE44 38.2% rule, The 38.2% retracement is the single most important one and is the level we use for the
educational Bitcoin hit 38.2% of the ATH and low at 83,812, following the ONE44 38.2% rule, (BTCUSDT) The 38.2% level is the single most important retracement and is the level we use for the "Golden Rule". This rule being, " any market that is going to keep its current trend must hold 38.2%". As long as it does the trend will
educational Gold Update & Targets There are two methods we use at ONE44 to find support and resistance in the markets. The first are major Gann squares, these are the yellow horizontal lines on the chart. The second is Fibonacci retracements. This is our latest Video on how to use the Fibonacci retracements with the
educational SP 500 & Gold Analysis 8/24/25 There are two methods we use at ONE44 to find support and resistance in the markets. The first are major Gann squares, these are the yellow horizontal lines on the chart. The second is Fibonacci retracements. This is our latest Video on how to use the Fibonacci retracements with the
educational New SP 500 Long Term Target ESU25 The chart is key to this analysis. From 4/7/25 ESM25 The big plunge overnight took it to 23.6% back to the 2009 low at 4850.00. Here is what is possible on a failure to get back above 38.2% back to the 2022 low at
educational New Fibonacci Video 5/3/25 How to use the Fibonacci retracements with the ONE44 rules and guidelines. There are two methods we use at ONE44 to find support and resistance in the markets. The first are major Gann squares, these are the yellow horizontal lines on the chart. On the chart you can see where
Paid-members only educational Summer Targets For Soybeans, Corn & Wheat Each market has been in a Bear market since the 2022 highs and they have done enough "work" meaning sideways trade anywhere from 8 months to a year and a half to warrant a look at what is possible on the condition these markets take out their short
educational SP 500 Futures Analysis, Our Long Term Target Has Been Hit, 5153.50 SP 500 Futures (ESM25) The chart is key to this analysis. ESM25 From 3/4/25 update, The idea of a long term top from the major Gann square cluster (6102.00/6142.00), 11/30/24 Above it, the long term target area above is 6102.00 to 6142.
educational SP 500 Futures Update 3/29/25 SP 500 Futures ESM25 From last week, The key long term 23.6% level back to the 2022 low at 5546.00 has produced a $200 rally so far. The front contract is now June, This week it hit 38.2% at 5760.00 on the continuation chart a few