Bitcoin/Ethereum

Bitcoin
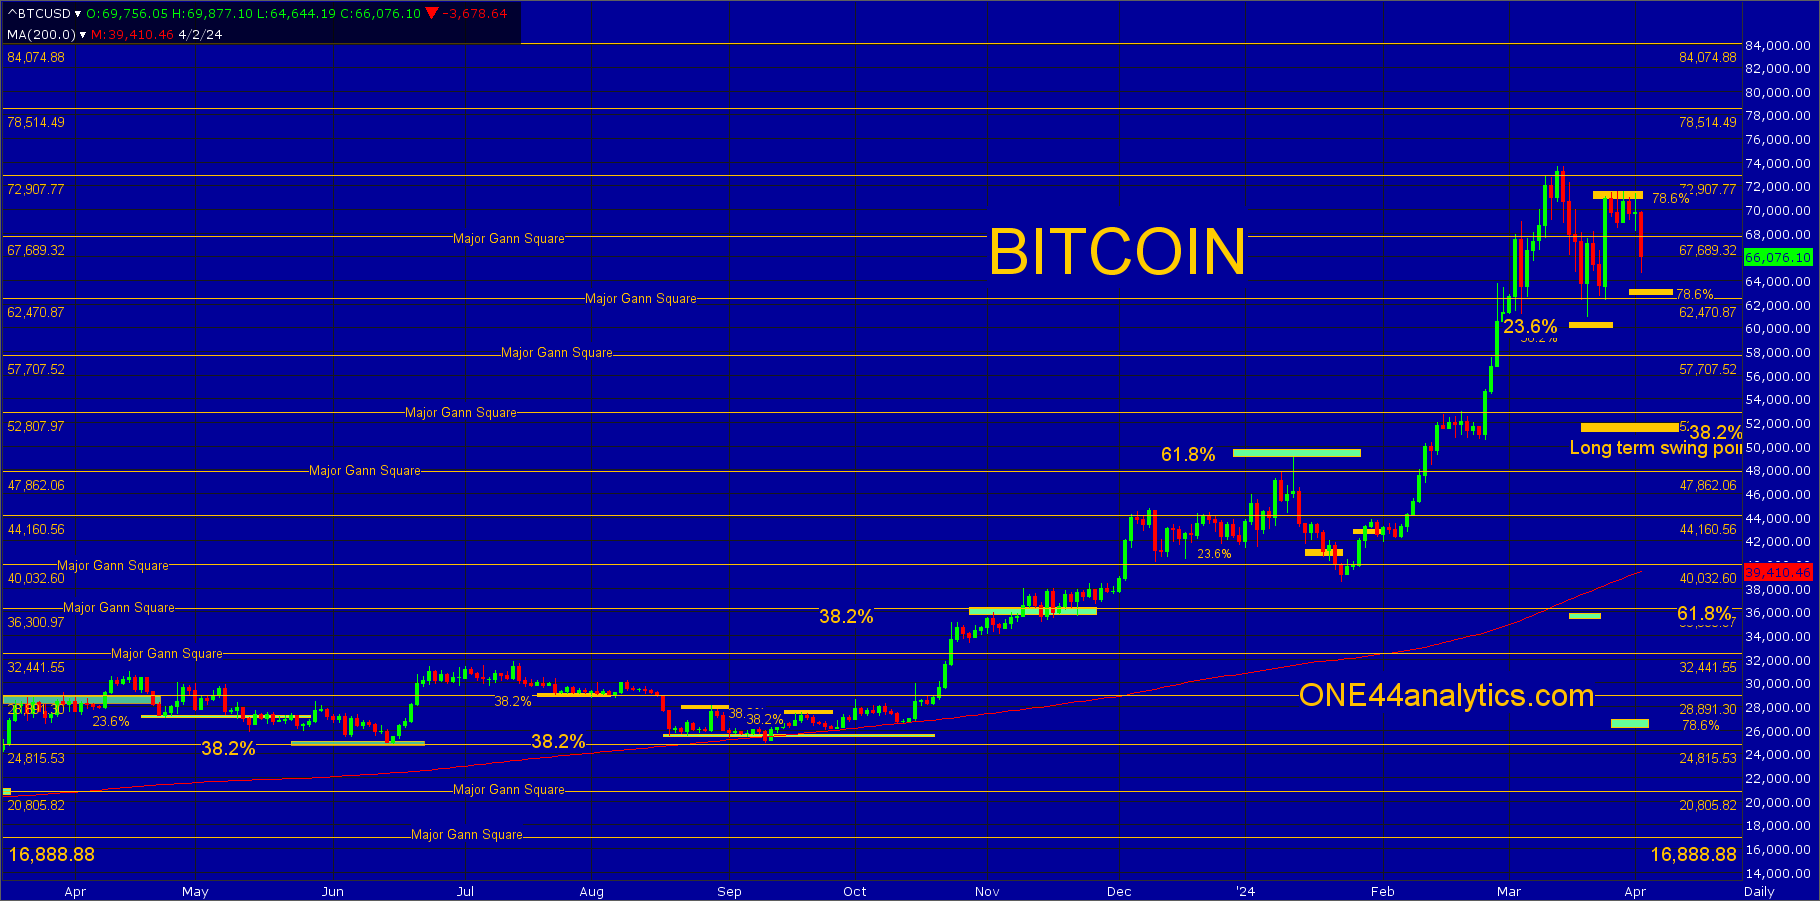
The setback on 3/20/24 held just above 23.6% back to the 2022 low at 60.500, this was also 38.2% back to the 1/23/24 low. This should have sent it to new highs to keep the trend extremely positive, however we watch all the retracements on every move to see just how strong, or weak the market is and in this case it hit 78.6% back to the 3/14/24 high at 70,900. It did trade up there for over a week. Not making a new high and hitting the 78.6% area can cause one of two things following the ONE44 78.6% rule. It can send it 78.6% back the other way and this would be 63,225, it can also be the end of a Bull market for now and if so, we would be looking for the long term swing point at 38.2% back to the 2022 low at 51.900.
On the current setback look for the area of 78.6% at 63,225 and the 62,470 major Gann square, holding this area would be a very strong sign and new highs should follow. A failure to turn higher from that area can send it down to the area of the 52,807 major Gann square and 38.2% back to the 2022 low at 51,900 (long term swing point).
Above 70,900 there are only major Gann squares to look for resistance and then as a swing point if closed above, the next two are 78,514 and 84,074.
Ethereum
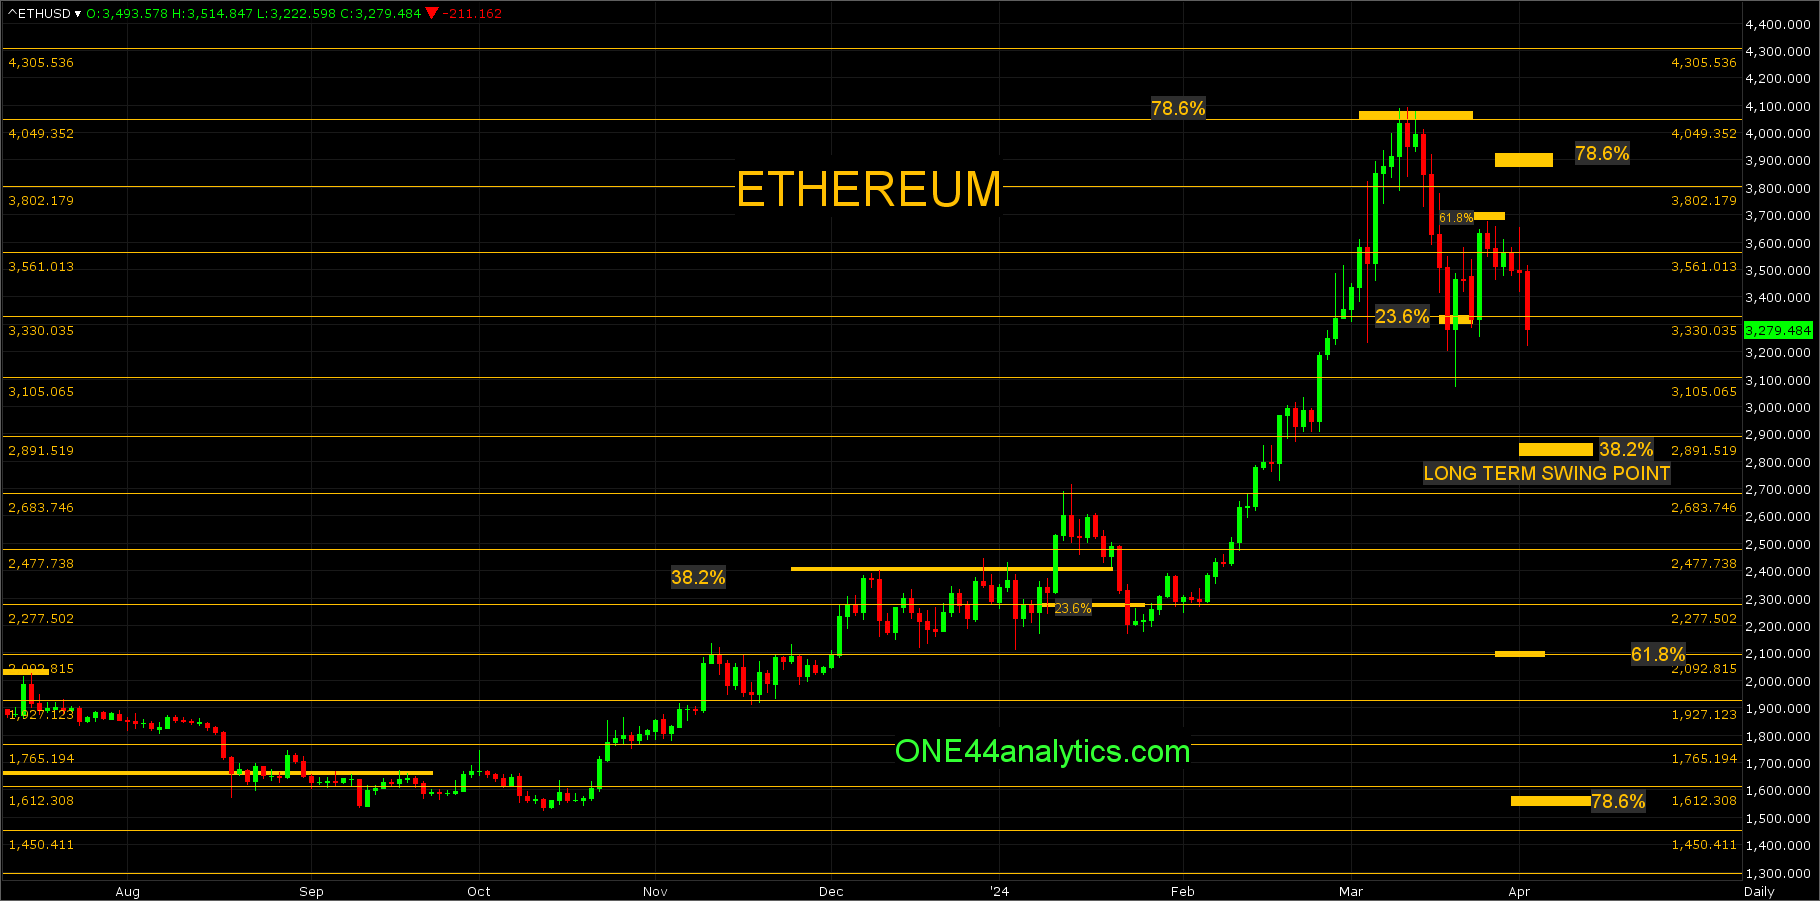
The break from 78.6% back to the ATH at 4049.00 took it below 23.6% back to the 2022 low at 3330.00, it had a couple slight closes below this level, but the next day it was right back above it to say it is still holding. The rally from that area fell well short of 78.6% back to the 3/12/24 high at 3880.00 and could only get to 61.8% at 3680.00. Use 3330.00 as the swing point for now.Above it, look for 78.6% back at 3880.00.Below it, look for the long term swing point at 2870.00.
FULL RISK DISCLOSURE: Futures trading contains substantial risk and is not for every investor. An investor could potentially lose all or more than the initial investment. Commission Rule 4.41(b)(1)(I) hypothetical or simulated performance results have certain inherent limitations. Unlike an actual performance record, simulated results do not represent actual trading. Also, since the trades have not actually been executed, the results may have under- or over-compensated for the impact, if any, of certain market factors, such as lack of liquidity. Simulated trading programs in general are also subject to the fact that they are designed with the benefit of hindsight. No representation is being made that any account will or is likely to achieve profits or losses similar to those shown. Past performance is not necessarily indicative of future results.