Bitcoin, Ethereum and 23.6%
ONE44 Analytics where the analysis is concise and to the point
Our goal is to not only give you actionable information, but to help you understand why we think this is happening based on pure price analysis with Fibonacci retracements, that we believe are the underlying structure of all markets and Gann squares.
For the ONE44 Fibonacci rules and guidelines to help with this article, go here.
Charts are courtesy of Barchart.com
Cryptocurrencies
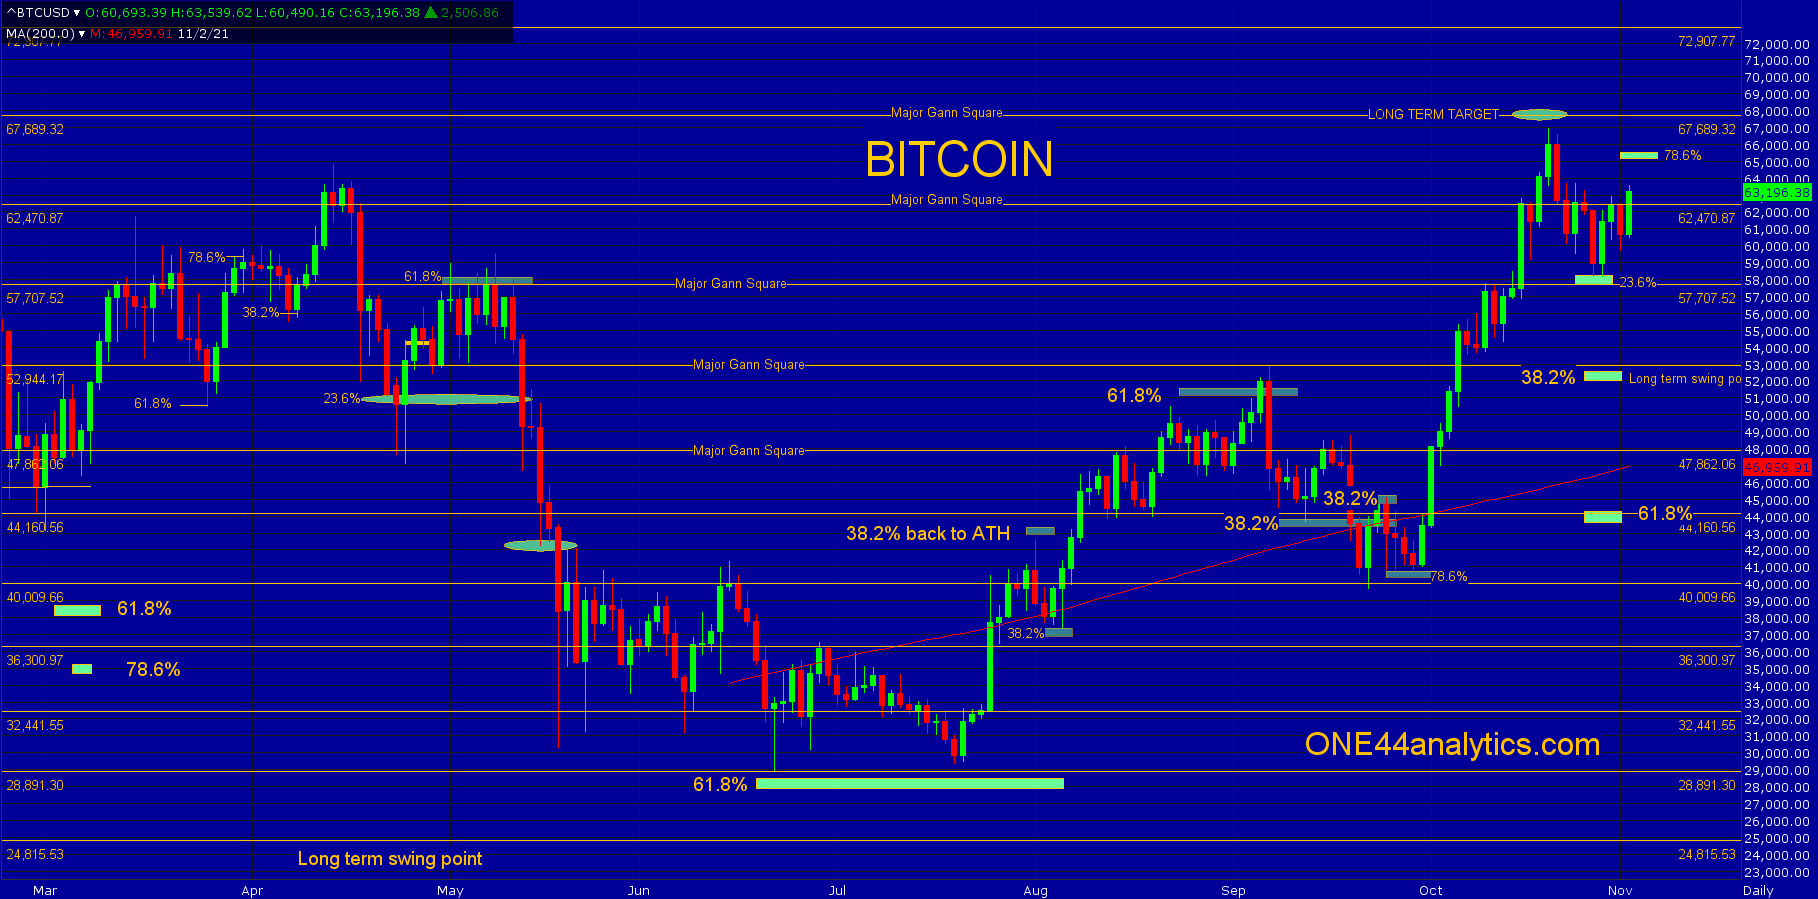
The break after falling just short of the long term target at 67,689 was only able to go 23.6% back to the 6/22/21 low and we know following the ONE44 Fibonacci rules and guidelines that,
Extremely strong/weak markets will only go back 23.6%. This is Typically a runaway market.
So, we should be looking for new highs from there. Provided they do make that new high look for the Major Gann squares of 72,907 and 78,519 the long term target is much higher and will be addressed in future posts. In our previous update on major Gann squares we also mentioned that we like to find the areas that have both, a Fibonacci retracement and major Gann square to find the best levels of support and resistance. The current low on 10/28/21 also held just above the major Gann square of 57,700. As we always say, "we will watch all of the retracements on any move to see just how strong, or weak a market is regardless of the long term targets", so watch 78.6% at 65,100 on this rally. Following the 78.6% rule, we know that a break from here should take it back to 78.6% (59,900) of where it just came from and secondly, this is where a lot of Bull runs end. A failure to make a new high after holding 23.6% at 58,201 should send it down to the area of 52,600 to 52,100, this is 38.2% of the same move and 23.6% back to the 2018 low, also in this area is the 52,950 major Gann square. A violation of this area (52,100) will turn the long term trend negative and we would then start to watch the retracements above to see if the new trend will continue.
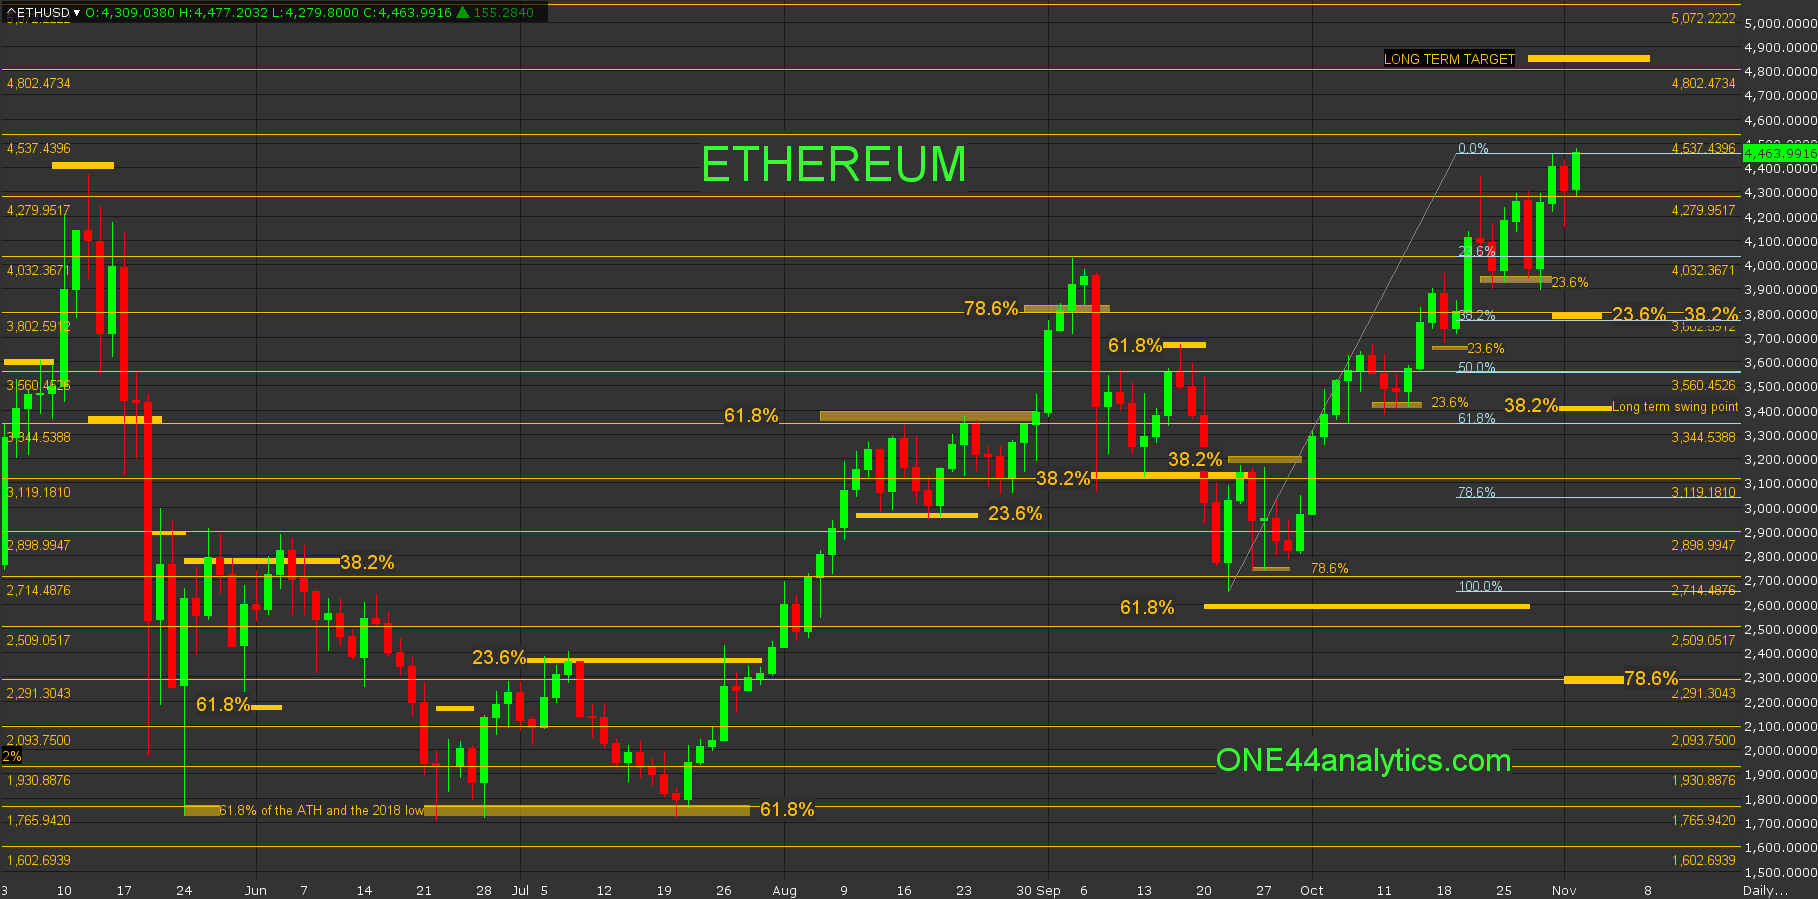
Ethereum proved to be even more powerful than Bitcoin, as the setback from the 10/21/21 high was only able to get to 23.6% of the 9/22/21 low. Each setback on the rally from that low held 23.6% as marked on the chart below. You can also see all the highs and lows that have hit Fibonacci retracements, proving how important they are. You can see more about this in the last Ethereum update. Our long term target is 4840.00 and there is one other major Gann square before then at 4537.00. The two major areas of support are 3802.00 to 3790.00, this is 38.2% back to the 9/22/21 low, 38.2% back to the 5/24/21 low and a major Gann square. The second area is 3451.00 to 3360.00, this 23.6% back to the 2020 low. 38.2% back to the 5/24/21 low, 61.8% back to the 9/24/21 low and a major Gann square.
Sign up for our Free newsletter here.
FULL RISK DISCLOSURE: Futures trading contains substantial risk and is not for every investor. An investor could potentially lose all or more than the initial investment. Commission Rule 4.41(b)(1)(I) hypothetical or simulated performance results have certain inherent limitations. Unlike an actual performance record, simulated results do not represent actual trading. Also, since the trades have not actually been executed, the results may have under- or over-compensated for the impact, if any, of certain market factors, such as lack of liquidity. Simulated trading programs in general are also subject to the fact that they are designed with the benefit of hindsight. No representation is being made that any account will or is likely to achieve profits or losses similar to those shown. Past performance is not necessarily indicative of future results.