Ethereum and the Fibonacci structure that led to this rally
ONE44 Analytics where the analysis is concise and to the point
Our goal is to not only give you actionable information, but to help you understand why we think this is happening based on pure price analysis with Fibonacci retracements, that we believe are the underlying structure of all markets and Gann squares.
For the ONE44 Fibonacci rules and guidelines to help with this article, go here.
Charts are courtesy of Barchart.com
Ethereum
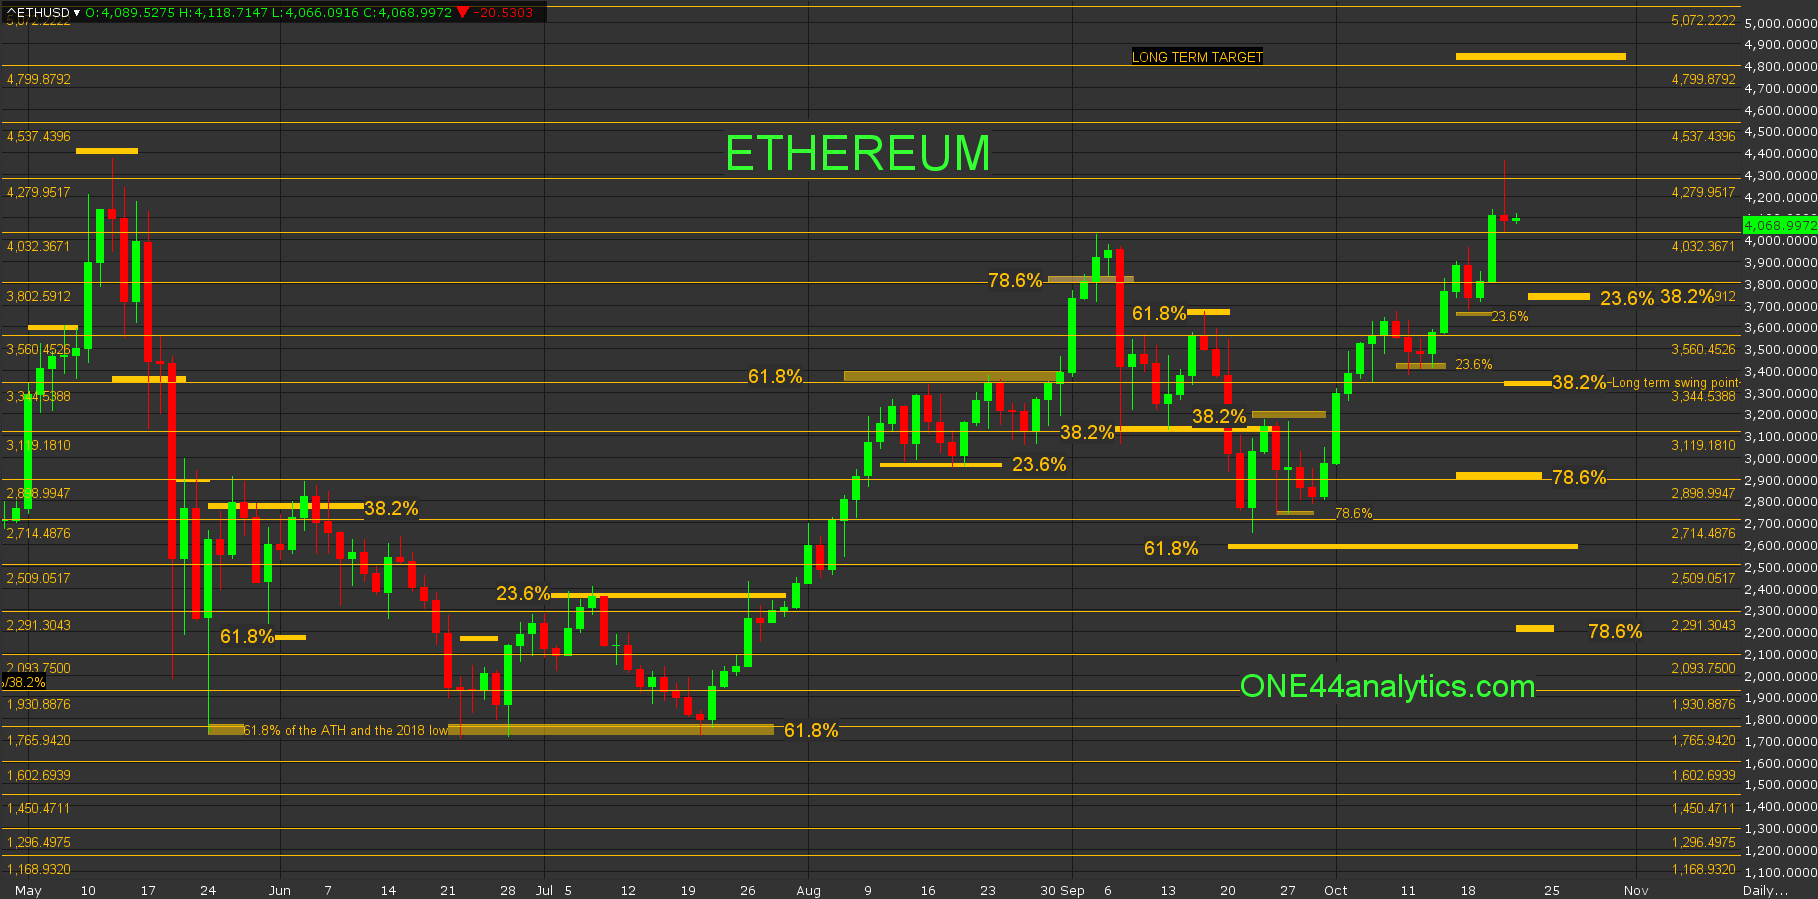
This update will show you why watching all the retracements on every move is so important regardless of the long term targets. On the chart you can see all of the major retracements that were held going back to May coming off of the ATH, however we will start with the break from the 9/3/21 high.
The low on 9/7/21 hit 38.2% (3150.00) of the rally from the low that was 61.8% (1740.00) from the ATH and the 2020 low. Following the ONE44 Fibonacci rules and guidelines we should have been looking for new highs. This didn't happen and it stopped at 61.8% on 9/16/21 and failing to make a new high after holding 38.2% should send it to 61.8% of the same move. This was 2610.00, it did get close on 9/22/21 and the rally from that hit 38.2% (3180.00) on 9/23/21 keeping the trend negative and the idea of getting to 2610.00 alive.
We now get to what set up this huge rally to retest the ATH. We were looking for new lows, however the 78.6% rule came into play, this is,
“Any market that hits 78.6% should go 78.6% back the other way. This is also where a lot of Bull markets end and start.”
The second part of this is what was so important to the market turning around. With the market failing to make a new low after holding 38.2% on 9/23/21 we knew that we should be looking for at least 61.8% of that same move based on the ONE44 rules and guidelines. They got that and more. We also know that a lot of new Bull runs start at 78.6% and this is where the huge run up started. The rally was so strong that all it could set back was 23.6% and the 23.6% rule is,
“Extremely strong/weak markets will only go back 23.6%. This is Typically a runaway market.”
This happened two different times, once on 10/11/21 and then again on 10/18/21.
Currently,
Now that they have retested the ATH there are no retracements above, our long term target is 4830.00 for other reasons and we will now watch the retracements below to see if the trend will continue. The first area of longer term support is the combination of 38.2% of the 9/22/21 low and 23.6% of the 5/24/21 low, this level is 3750.00. Holding this level keeps the trend extremely strong. The long term swing point is 38.2% back to the 5/24/21 low, this is the level that would have to be taken out to turn the long term trend negative.
Sign up for our Free newsletter here.
FULL RISK DISCLOSURE: Futures trading contains substantial risk and is not for every investor. An investor could potentially lose all or more than the initial investment. Commission Rule 4.41(b)(1)(I) hypothetical or simulated performance results have certain inherent limitations. Unlike an actual performance record, simulated results do not represent actual trading. Also, since the trades have not actually been executed, the results may have under- or over-compensated for the impact, if any, of certain market factors, such as lack of liquidity. Simulated trading programs in general are also subject to the fact that they are designed with the benefit of hindsight. No representation is being made that any account will or is likely to achieve profits or losses similar to those shown. Past performance is not necessarily indicative of future results.