Bitcoin, Ethereum and Fibonacci

Bitcoin/Ethereum
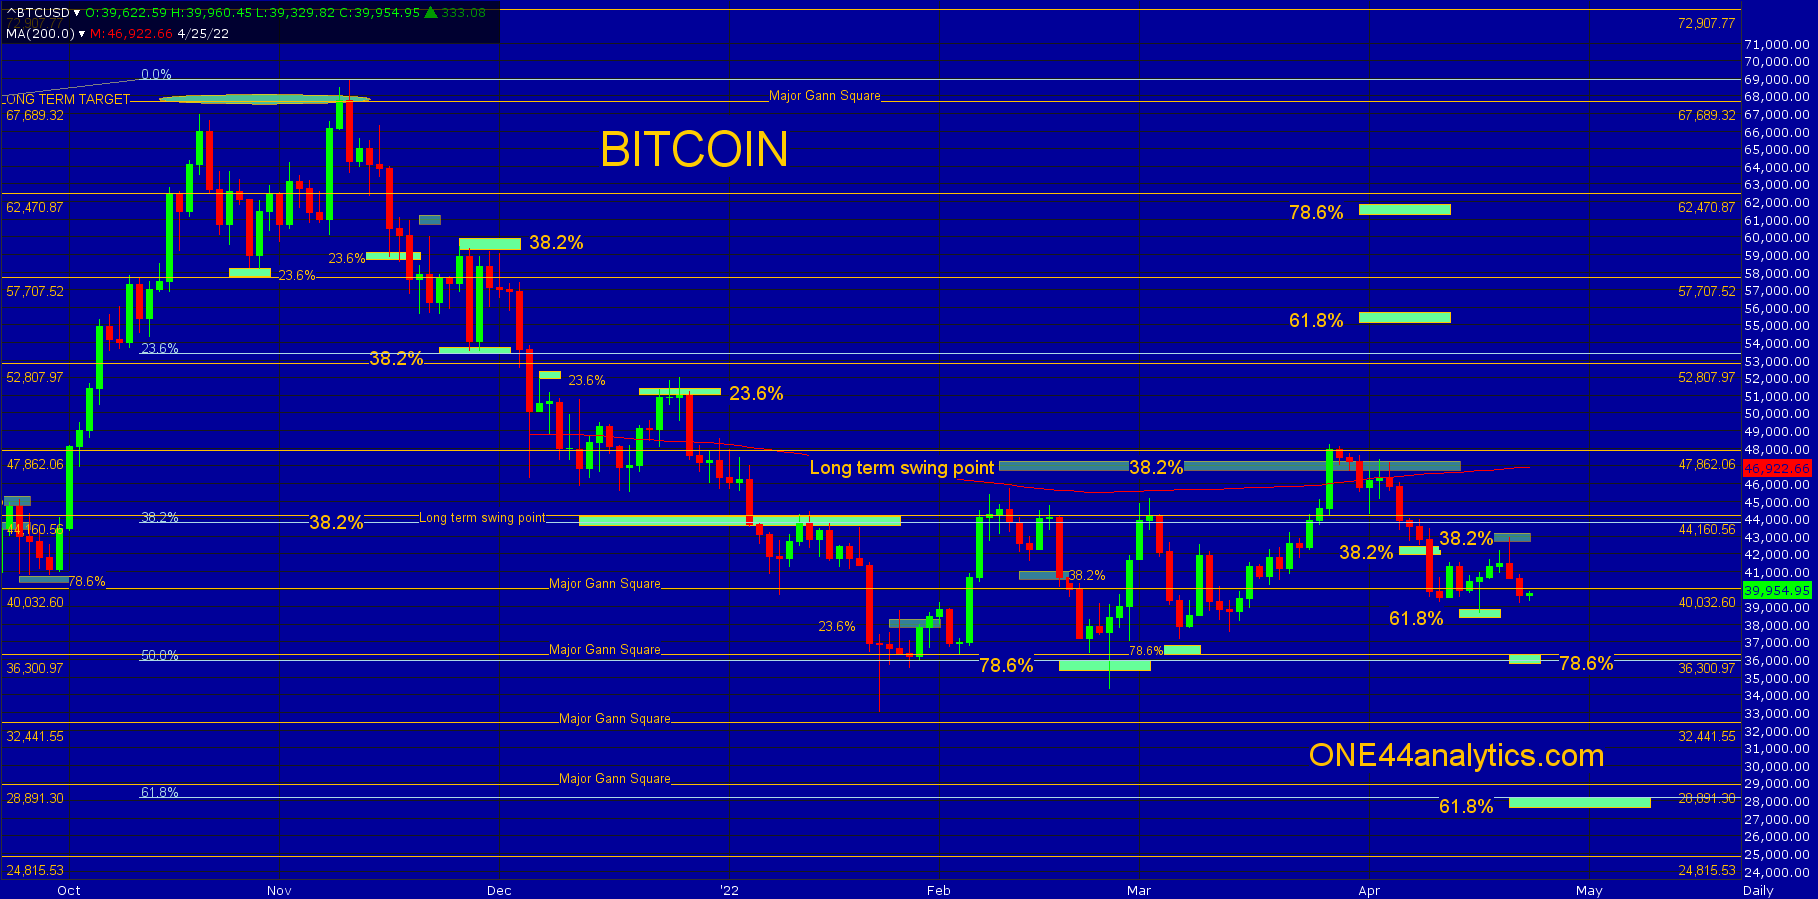
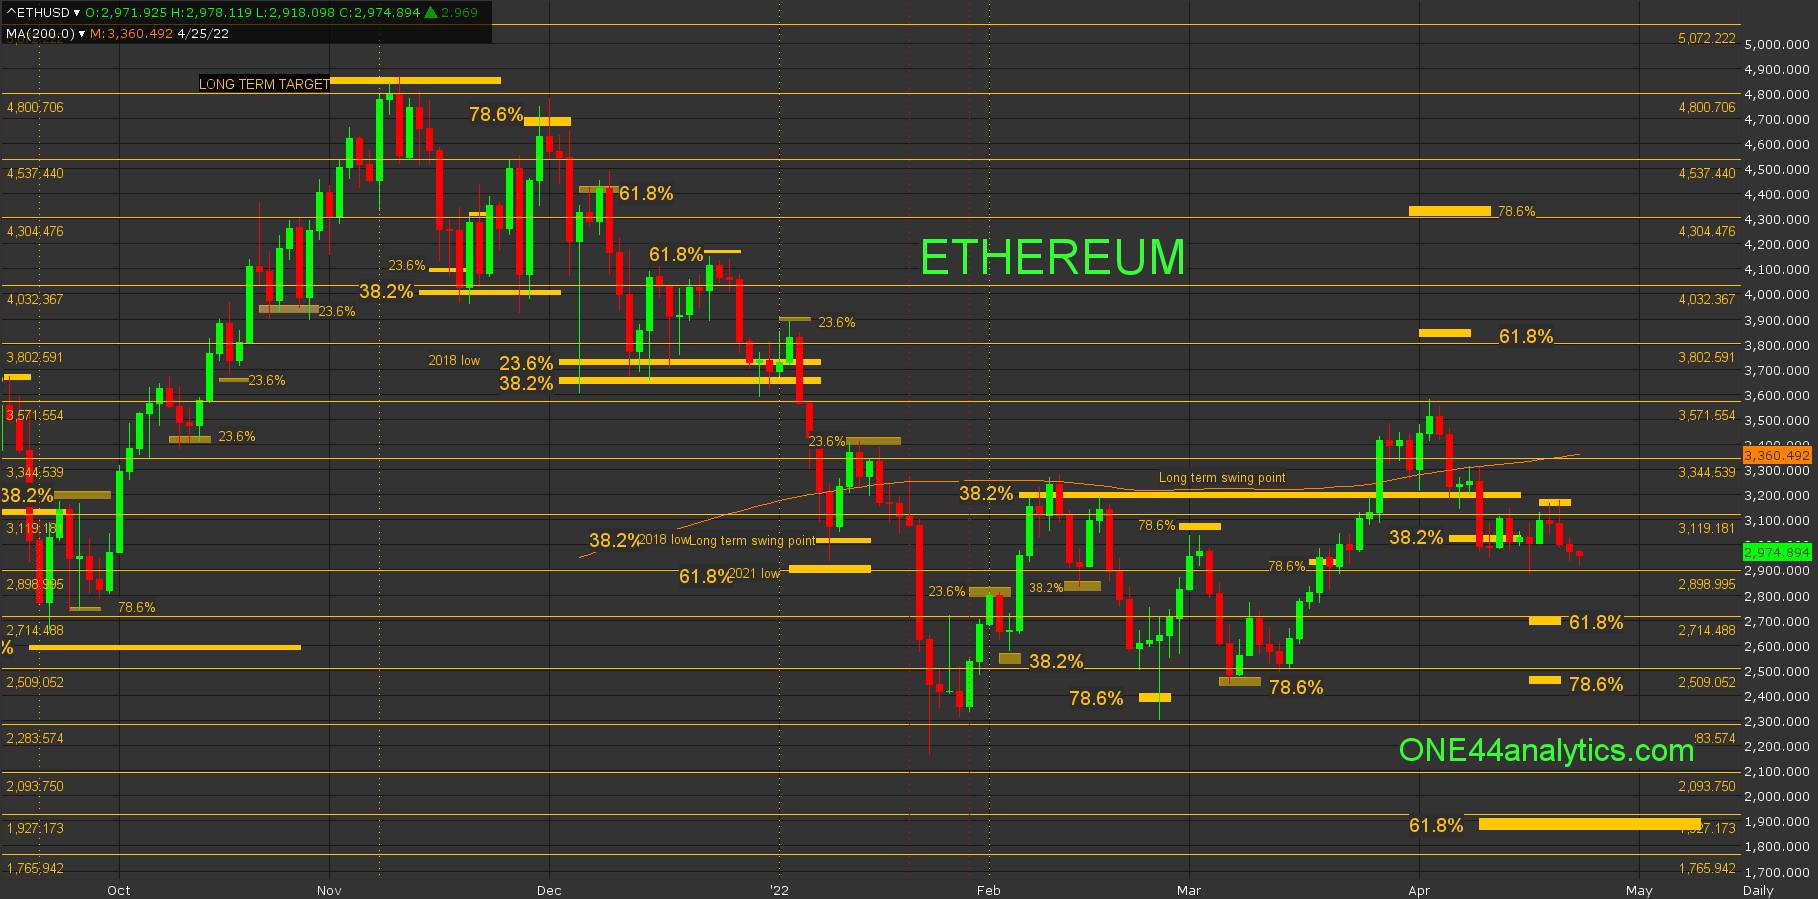
Thursday's highs for Bitcoin and Ethereum hit 38.2% of the recent break, keeping the short term trend negative as well as the long term trend. For Bitcoin it was 42,750 and for Ethereum it was 3140.00.
Bitcoin
The high on 3/28/22 hit the 47,862 major Gann square and closed above the long term swing point at 46,800, this is 38.2% back to the ATH. Three days later it was back below it and the 200 day average and this turned the long term trend negative again. The break from there took it to 61.8% of the recent rally on 4/18/22 and the rally from that could only get to 38.2% of the break on Thursday and that keeps the short term negative as well. The short term target on a break from 42,750 is 78.6% at 36,300 and a major Gann square. The long term target is 61.8% of the ATH and the 2018 low at 28,000. Provided they can get back above 42,750, look for the long term swing point again.
Ethereum
The high on 4/4/22 was well above the long term swing point of 3190.00, however it did stop at the 3571.00 major Gann square. Five trading days later it was back below the long term swing point, but holding 38.2% of the recent rally at 3030.00. The spike below 3030.00 on 4/18/22 hit the 2898.00 major Gann square and closed back above 3030.00. The rally from there could only get back to 38.2% on Thursday at 3140.00, keeping the short term trend negative. The short term target is 61.8% at 2714.00, this is also a major Gann square. The long term target is 61.8% of the ATH and the 2018 low at 1900.00. Provided it can get back above 3140.00, it would turn the short and long term trend positive and if so, look for 61.8% back to the ATH at 3830.00.
This is our latest video on using Fibonacci retracements with the ONE44 rules and guidelines. It deals with the Grain market. Even if you do not trade Grains it is worth watching. All the rules and guidelines work in ALL markets. We also have videos for other markets on our YouTube channel.
Sign up for our Free newsletter here.
FULL RISK DISCLOSURE: Futures trading contains substantial risk and is not for every investor. An investor could potentially lose all or more than the initial investment. Commission Rule 4.41(b)(1)(I) hypothetical or simulated performance results have certain inherent limitations. Unlike an actual performance record, simulated results do not represent actual trading. Also, since the trades have not actually been executed, the results may have under- or over-compensated for the impact, if any, of certain market factors, such as lack of liquidity. Simulated trading programs in general are also subject to the fact that they are designed with the benefit of hindsight. No representation is being made that any account will or is likely to achieve profits or losses similar to those shown. Past performance is not necessarily indicative of future results.