Natural Gas going to 3.40, Don't be surprised!

Natural Gas
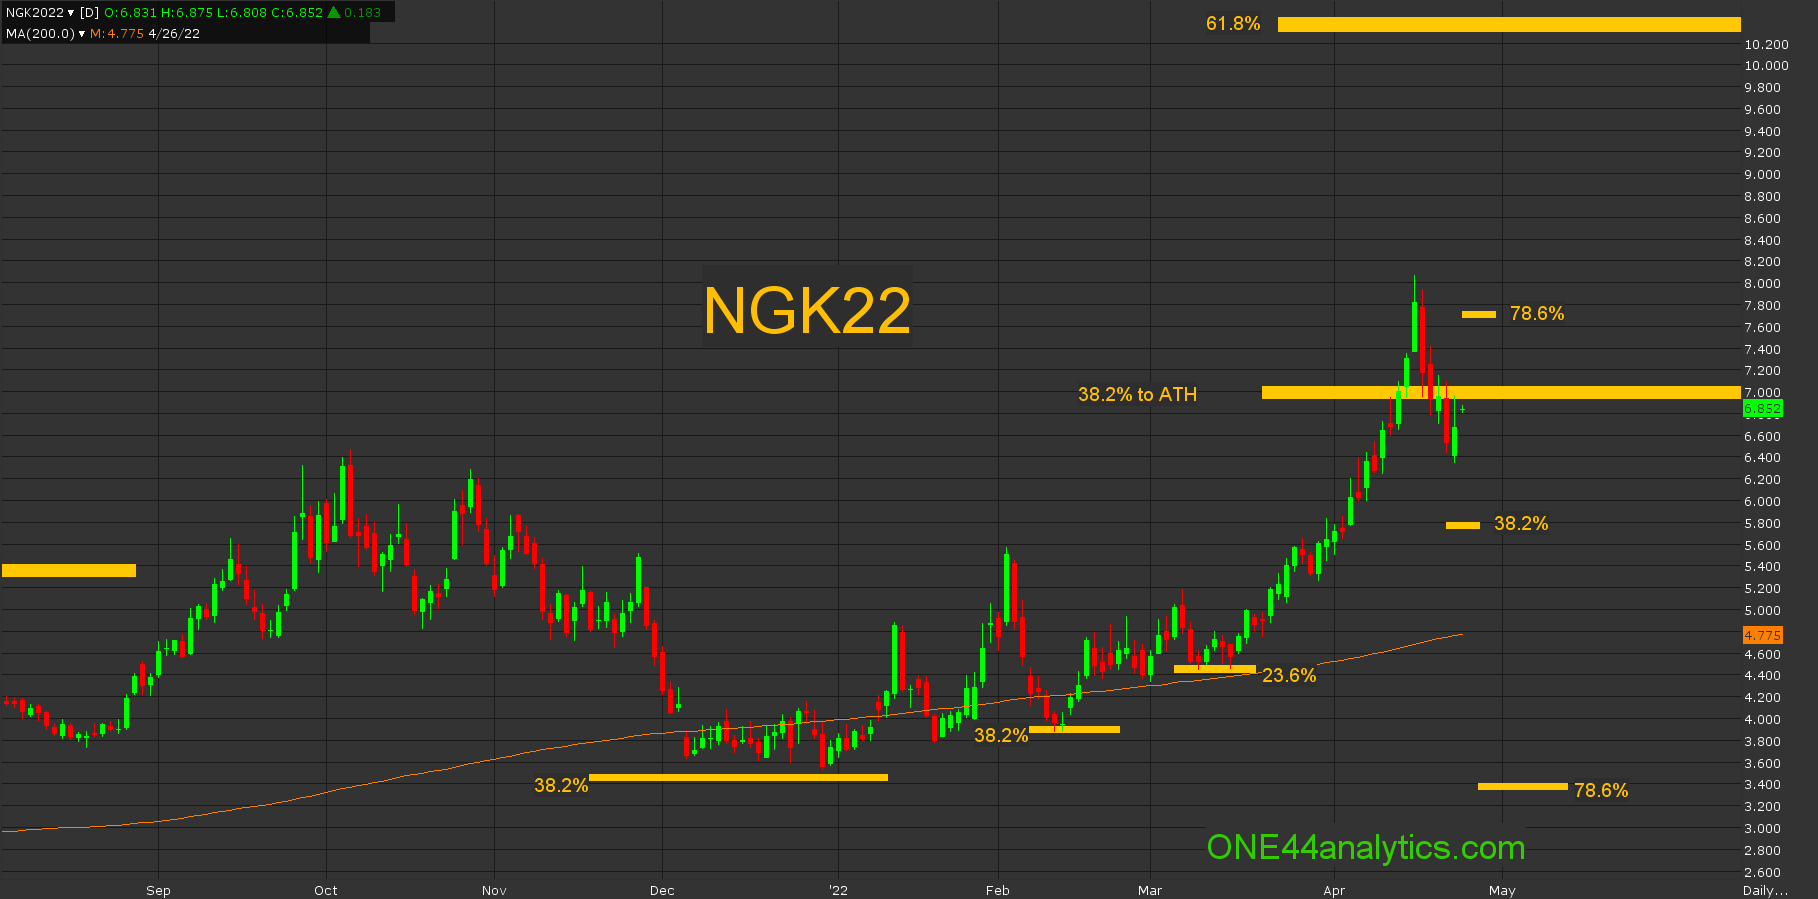
In our post on Natural gas and the Natural flow of markets on 4/4/22 we gave an upside target of 6.95. This has now been reached and exceeded, so now what? We recommend view this past post for the long term view.
The fact that 6.95 was 38.2% of the ATH and ATL makes it a major level to be watched. It has now gone a 1.00 through it and is back below 6.95 and as the weekly chart shows in the previous post, once they react from key retracements the breaks become severe. Just as the retracements from the two most important highs, one being the ATH and then the retest of that in 2008 have marked the spike highs in 2010, 2014, 2018 and 2021. We think the same can follow as long as it remains below 6.95. A target on a major pull back can take it to 78.6% over time as it did in all the previous moves except for the 2021 high, this is 3.40. As always we watch all the retracements regardless of the long term target to see just how weak, or strong the market is, so the key level to watch is 38.2%.
38.2% is the single most important retracement and is the level we use for the "Golden Rule". This rule being, " any market that is going to keep its current trend must hold 38.2%". As long as it does the trend will continue and it should make new highs/lows from that retracement.
This is 5.80, provided this was all it could break, it would keep the current run up very positive and with a couple closes again above 6.95 we would be looking for 61.8% of the ATH and ATL at 10.29.
One other level to watch if it gets back above 6.95 is 78.6% at 7.70, this retracement has a way of ending a lot of Bull markets, per the ONE44 78.6% rule.
Sign up for our Free newsletter here.
FULL RISK DISCLOSURE: Futures trading contains substantial risk and is not for every investor. An investor could potentially lose all or more than the initial investment. Commission Rule 4.41(b)(1)(I) hypothetical or simulated performance results have certain inherent limitations. Unlike an actual performance record, simulated results do not represent actual trading. Also, since the trades have not actually been executed, the results may have under- or over-compensated for the impact, if any, of certain market factors, such as lack of liquidity. Simulated trading programs in general are also subject to the fact that they are designed with the benefit of hindsight. No representation is being made that any account will or is likely to achieve profits or losses similar to those shown. Past performance is not necessarily indicative of future results.