Bitcoin, Ethereum have one close below their long term swing points
ONE44 Analytics where the analysis is concise and to the point
Our goal is to not only give you actionable information, but to help you understand why we think this is happening based on pure price analysis with Fibonacci retracements, that we believe are the underlying structure of all markets and Gann squares.
Here is a quick set of guidelines for the Fibonacci retracements to help with this article. You can find all the rules/guidelines and examples on any deviations from these four basic rules on our website.
1) The Golden rule, any market that is going to continue the current trend must hold 38.2% and a new high/low should follow.
2) Markets that are extremely strong/weak will only go 23.6% and a new high/low should follow. Typically a runaway market.
3) The 61.8% rule is, any market that holds 61.8% should go 61.8% of where it just came from. Usual happens when a market is directionless, or in a consolidation period.
4) The 78.6% rule is, any market that holds 78.6% should go 78.6% of where it just came from. This is also where a lot of Bull markets end and start.
Charts are courtesy of Barchart.com
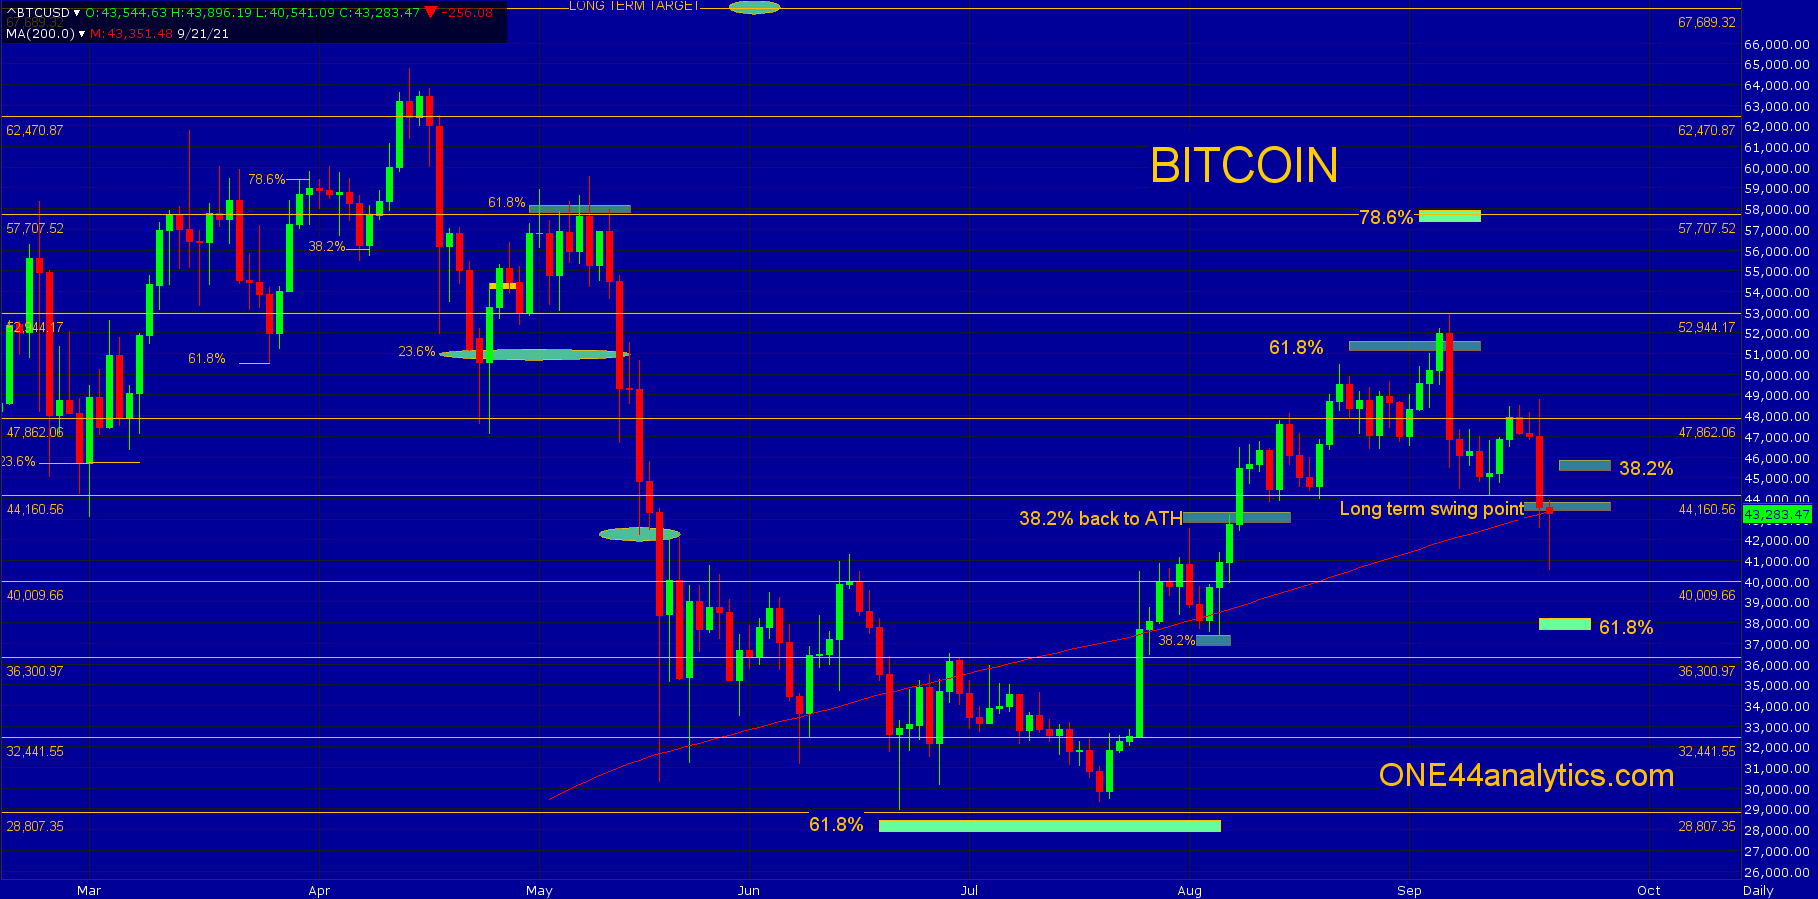
Bitcoin
The rally after holding the long term swing point of 43,850, failed to make a new high for the move and now has one close below it. We always want to see a second close below it to confirm the violation of that level. The long term swing point is 38.2% of the 9/7/21 high and 6/22/21 low. Following the ONE44 Fibonacci rules and guidelines we know when it reacts from 38.2% and fails to make that new high we should look for 61.8% on the next setback and this is 38,200.
We already were looking for 38,200 based on the 61.8% rule. That rule is any market that holds 61.8% should go back 61.8% of where it just came from. The September high was in the area of 61.8% using the ATH and the 6/22/21 low. As an example of the 61.8% rule, the 6/22/21 low was just above 61.8% of the ATH and the 2018 low and that gave us the target of 51.200 that happened on 9/6/21. You can see the post that said just this on 6/22/21 here.
This was from the post 9/12/21
Failing to hold the long term swing point should send it to 61.8% and most likely it goes into a wide trading range between the June low and Sept. high for the next few months.
Provided it closed back above the long term swing point today, it would still need to take out 38.2% of the current break at 45,400 to say they should go for the 9/7/21 high again.
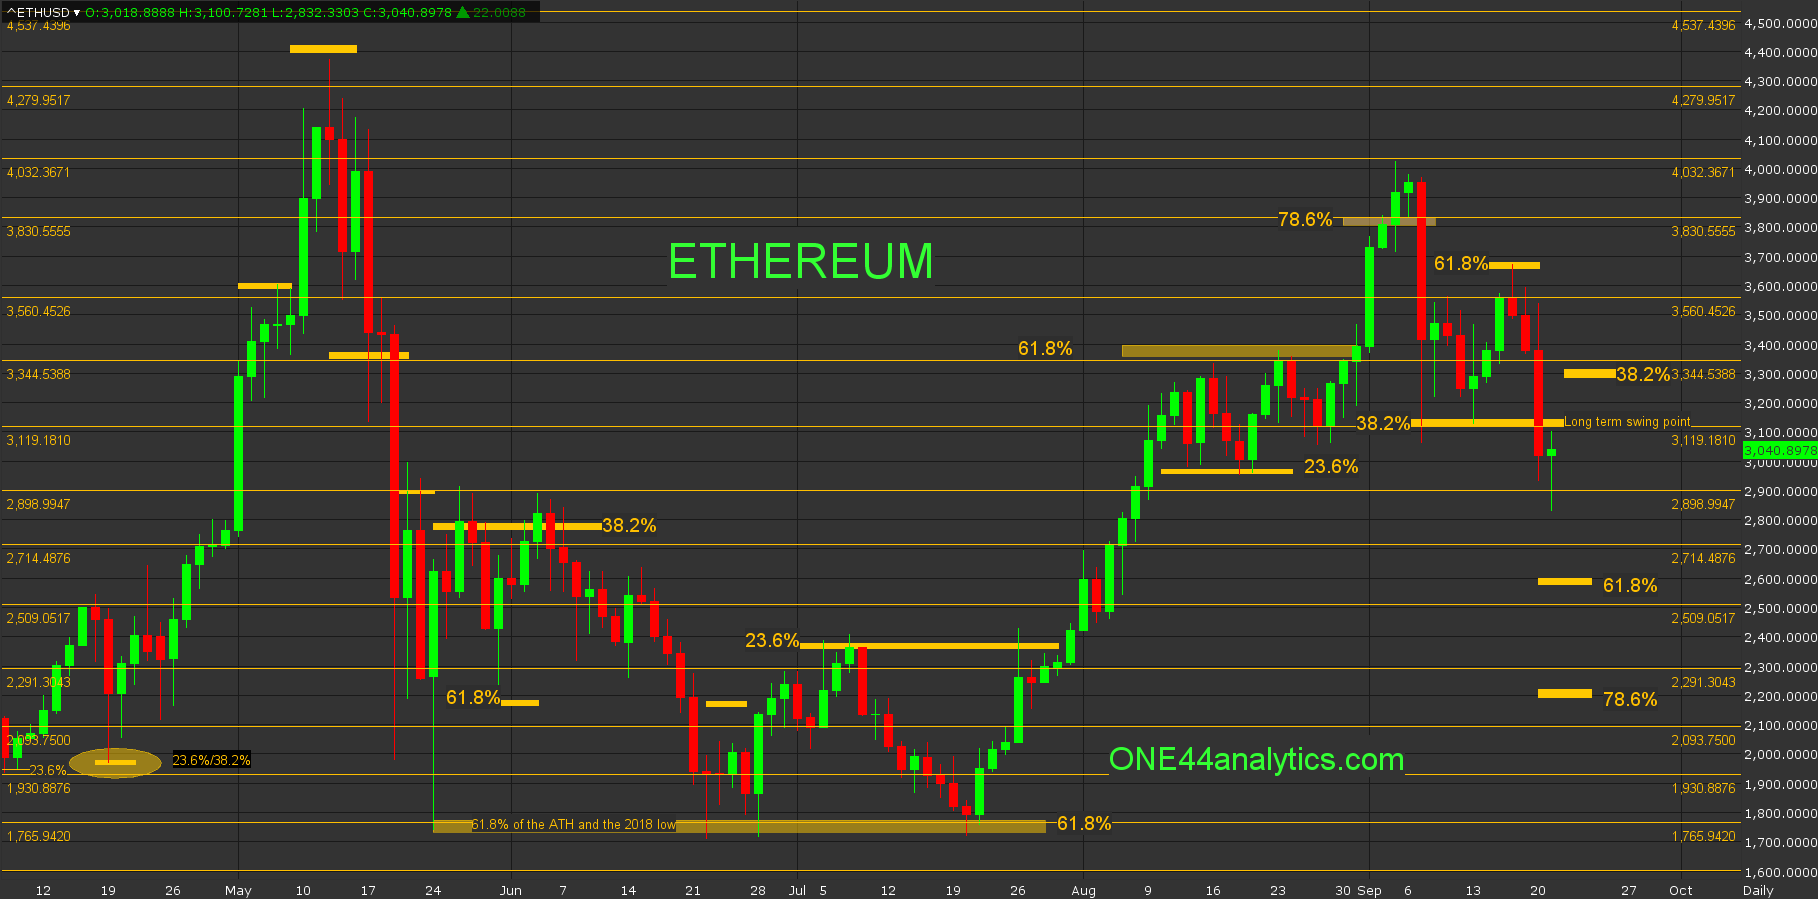
Ethereum
9/12/21
The break from the area of 78.6% at 3840.00 and the 4032.00 major Gann square has already hit 38.2% of the move up at 3150.00, it traded below it on the 7th and tested it again on Friday, this is the long term swing point. Above it they go for new highs and then a new ATH. Below it can send it to 78.6% at 2200.00. Here too, if the long term swing point is taken out, it can go into a wide swinging trading range for the next few months.
Currently,
The rally from the long term swing point of 3150.00 was only able to get to 61.8% of the break from the 9/3/21 high. As we said above, a failure to make a new high after holding 38.2% should send it to 61.8% of the same move. Since the high was in the 78.6% area, the target from there is 78.6% based on the 78.6% rule and this is 2200.00. These levels are possible with another close below the long term swing point. With a close back above it, it would still have to take out 38.2% of the current break at 3290.00 to say it is going for the highs again.
Sign up for our Free newsletter here.
FULL RISK DISCLOSURE: Futures trading contains substantial risk and is not for every investor. An investor could potentially lose all or more than the initial investment. Commission Rule 4.41(b)(1)(I) hypothetical or simulated performance results have certain inherent limitations. Unlike an actual performance record, simulated results do not represent actual trading. Also, since the trades have not actually been executed, the results may have under- or over-compensated for the impact, if any, of certain market factors, such as lack of liquidity. Simulated trading programs in general are also subject to the fact that they are designed with the benefit of hindsight. No representation is being made that any account will or is likely to achieve profits or losses similar to those shown. Past performance is not necessarily indicative of future results.