Bitcoin, Ethereum hit the first key support from our long term targets
ONE44 Analytics where the analysis is concise and to the point
Our goal is to not only give you actionable information, but to help you understand why we think this is happening based on pure price analysis with Fibonacci retracements, that we believe are the underlying structure of all markets and Gann squares.
For the ONE44 Fibonacci rules and guidelines to help with this article, go here.
Charts are courtesy of Barchart.com
We have a new video explaining how to use the Fibonacci retracements based on the ONE44 rules and guidelines. Even if you do not trade the markets in it, the rules are the same for ALL markets.
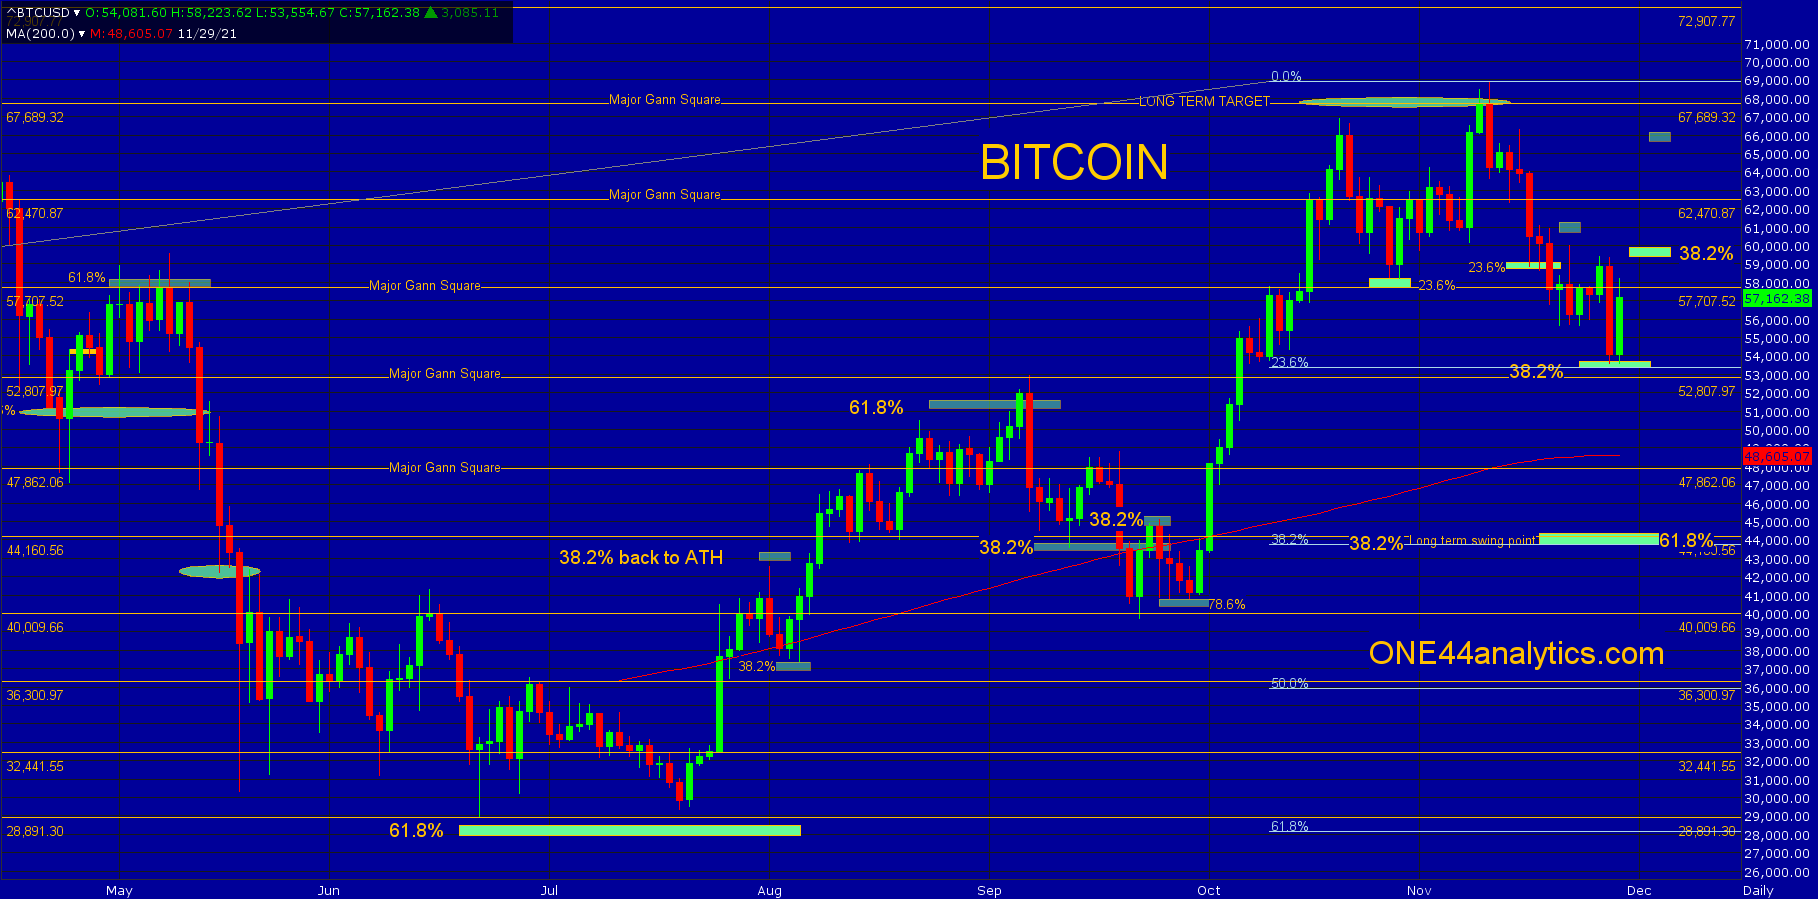
Bitcoin
In our last post on 11/9/21 it had just hit our long term target of 67,700 and we said this,
"Making a new high and failing to close above the previous high is not a good sign and a break from there can easily take it back to 38.2% of 6/22/21 low, this is 53,300 and just below it is a major Gann square at 52,800."
The next day it made a slightly higher high and closed below the previous high, this moved up the 38.2% level that was 53,300 to 53,700. What made this area even more important was that it was also 23.6% back to the 2018 low. Holding this area can send it to a new ATH, however we watch all the retracements to see just how strong, or weak a market is, regardless of the longer term target. The key level to watch will be 38.2% of the current break, this is 59,400, a failure to get above this level after hitting major levels below would be a negative sign and they should go for new lows. On an extended move lower, look for the long term swing point at 43,700, this is 38.2% back to the 2018 low, also in the area is a major Gann square and 61.8% back to the June low. For the upside, above 59,400 (38.2%) the short term trend turns positive and you can look for 78.6% at 65,600 before new highs.
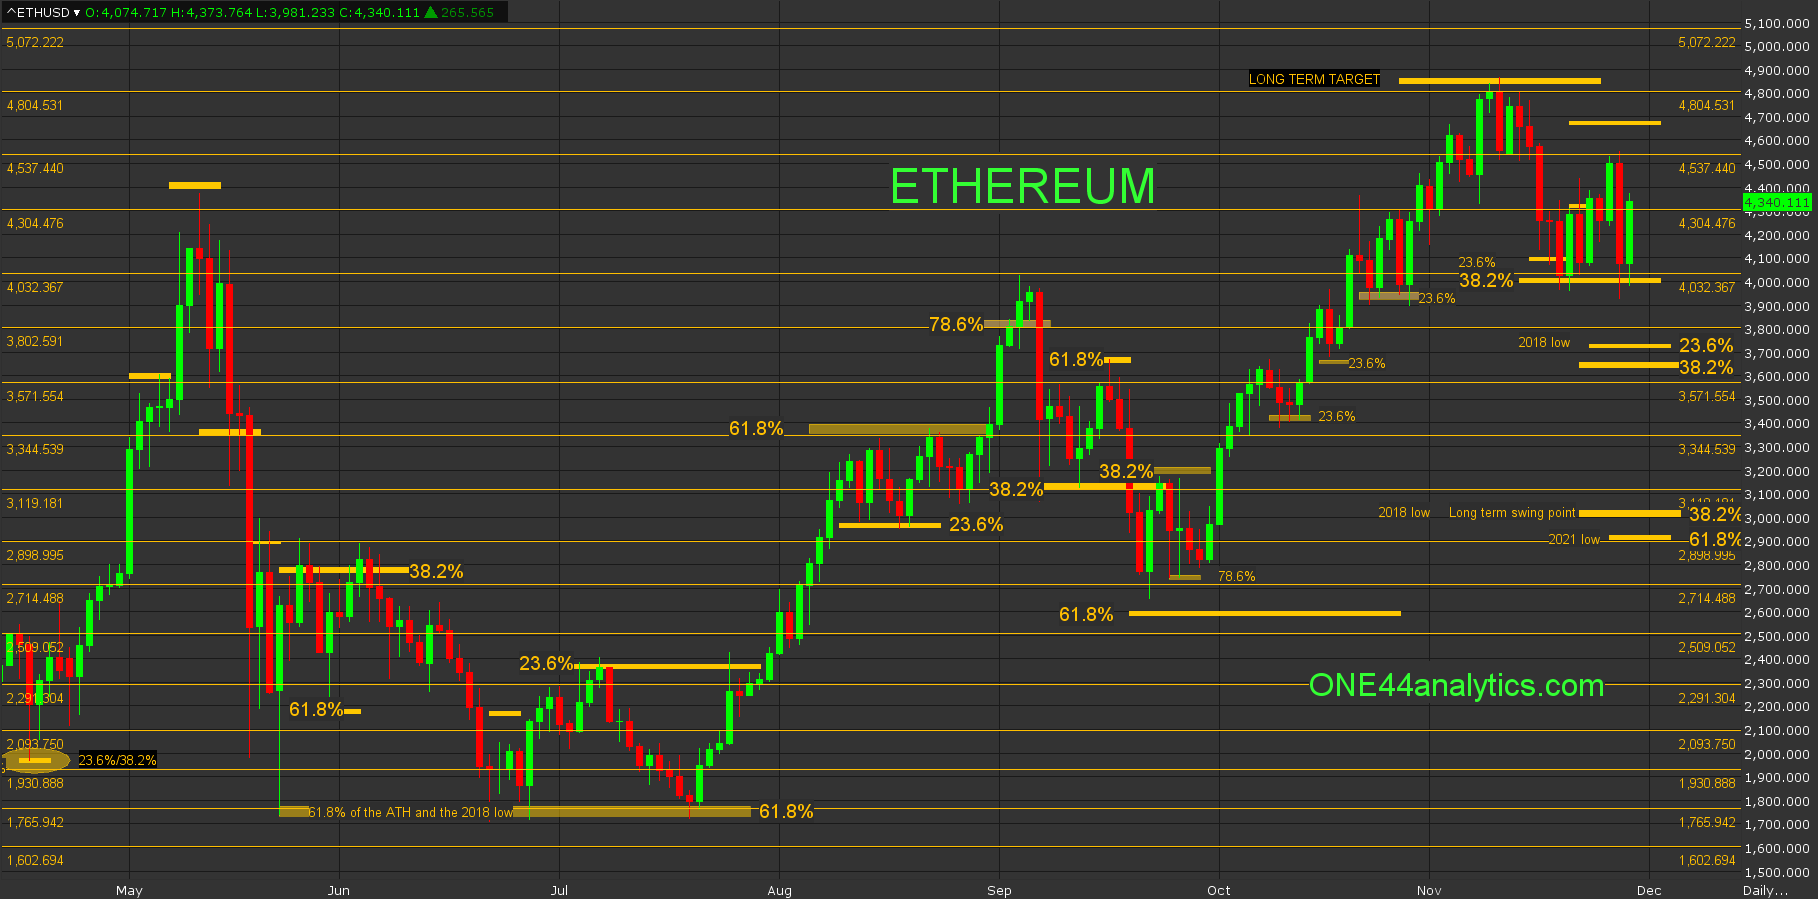
Ethereum
Ethereum had also just hit our long term target of 4840.00 on 11/9/21 and we said,
"On a bigger setback from 4840.00 look for 23.6% to the 5/24/21 low, this is 4090.00."
This area also had a major Gann square at 4032.00 and 38.2% (4016.00) back to the 9/22/21 low. The first time they traded down into this area on 11/18/21 the rally failed to make a new high, not a good sign, the market topped out at the 4537.00 major Gann square and then came back to the key area of 4090.00 to 4016.00. As long as it can hold this area, new highs are what to look for, but you always have to watch the 78.6% that is currently at 4670.00 for a possible top that has a longer term effect. The next major area of support is 3731.00 to 3660.00, this 23.6% of the 2018 low and 38.2% of the June low. The long term swing point is down at 3025.00, this is 38.2% of the 2018 low. We will update the long term targets on the upside once new ATH's have been established in both markets.
Sign up for our Free newsletter here.
FULL RISK DISCLOSURE: Futures trading contains substantial risk and is not for every investor. An investor could potentially lose all or more than the initial investment. Commission Rule 4.41(b)(1)(I) hypothetical or simulated performance results have certain inherent limitations. Unlike an actual performance record, simulated results do not represent actual trading. Also, since the trades have not actually been executed, the results may have under- or over-compensated for the impact, if any, of certain market factors, such as lack of liquidity. Simulated trading programs in general are also subject to the fact that they are designed with the benefit of hindsight. No representation is being made that any account will or is likely to achieve profits or losses similar to those shown. Past performance is not necessarily indicative of future results.