TSLA, 78.6% to the 78.6% target completed
ONE44 Analytics where the analysis is concise and to the point
Our goal is to not only give you actionable information, but to help you understand why we think this is happening based on pure price analysis with Fibonacci retracements, that we believe are the underlying structure of all markets and Gann squares.
For the ONE44 Fibonacci rules and guidelines to help with this article, go here.
Charts are courtesy of Barchart.com
This is our latest video in an ongoing series of how to use the Fibonacci retracements. Even if you do not trade the market covered, the ONE44 rules and guidelines are the same, as we believe the Fibonacci retracements are the underlying structure of all markets.
https://youtu.be/HEyLVbjvHDg
In our last TSLA update on 11/22/21 we left you with this,
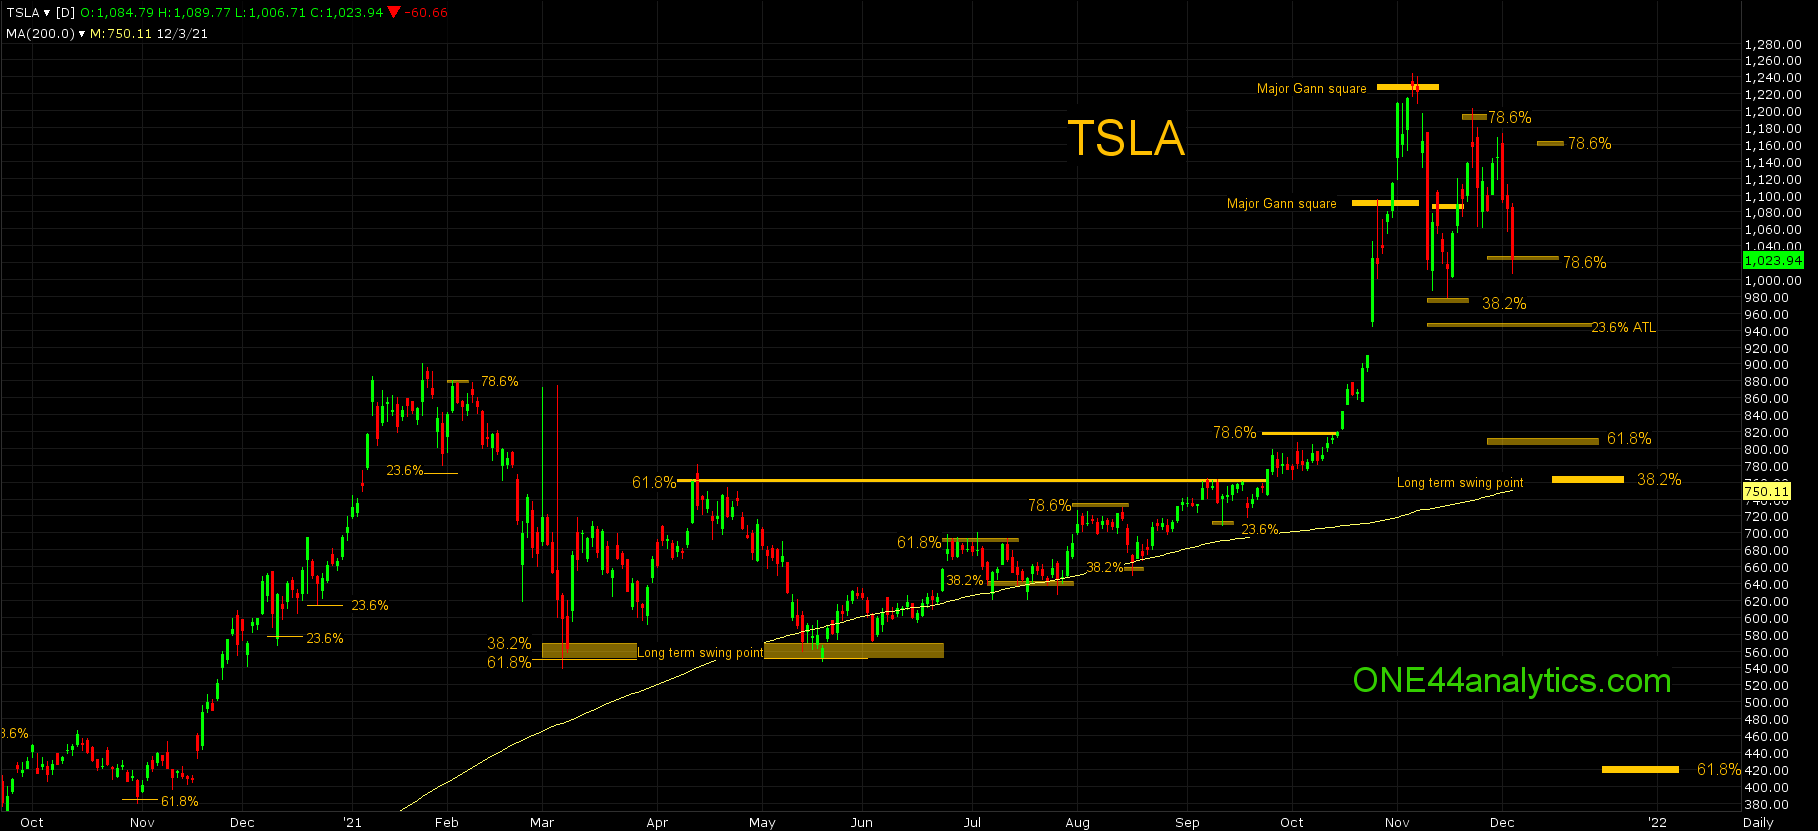
"We want to make it abundantly clear, Holding 38.2% back on 11/15/21 is a very positive sign and it should go for new highs and if so, look for the long term target at 1370.00. On the other side of this is, any failure to make the new high after holding 38.2%, the target becomes 61.8% of the same move and this is 812.00. Also a break from 78.6% should send it to 78.6% of where it just came from and this is 1028.00, it can also be the end of the Bull run. The 78.6% level does not always work, but when it does, it can be the start of big moves, you can find plenty of these examples in other posts on the site. With a couple closes above 78.6% (1188.00) look for the new highs and the long term target."
Today,
It has now reached the 78.6% target of 1028.00 based on the ONE44 78.6% rule. A rally from here can send it 78.6% the other way and this is 1160.00, keeping it in a wide trading range between the ATH and 38.2% (979.00)back to the 3/5/21 low. The other scenario is the failure to make a new high after holding 38.2% at 979.00, along with that failure coming at 78.6% (1188.00) can send it down to 61.8% at 812.00. Also in this area is the long term swing point at 770.00, this is 38.2% of the ATH and ATL and the 200 day average is fast approaching the same level. Another thing to watch for, if they take out 979.00, is it hits 948.00 and closes back above 979.00, this is 23.6% of the ATH and ATL. Provided this did happen, look for a quick move back to the ATH.
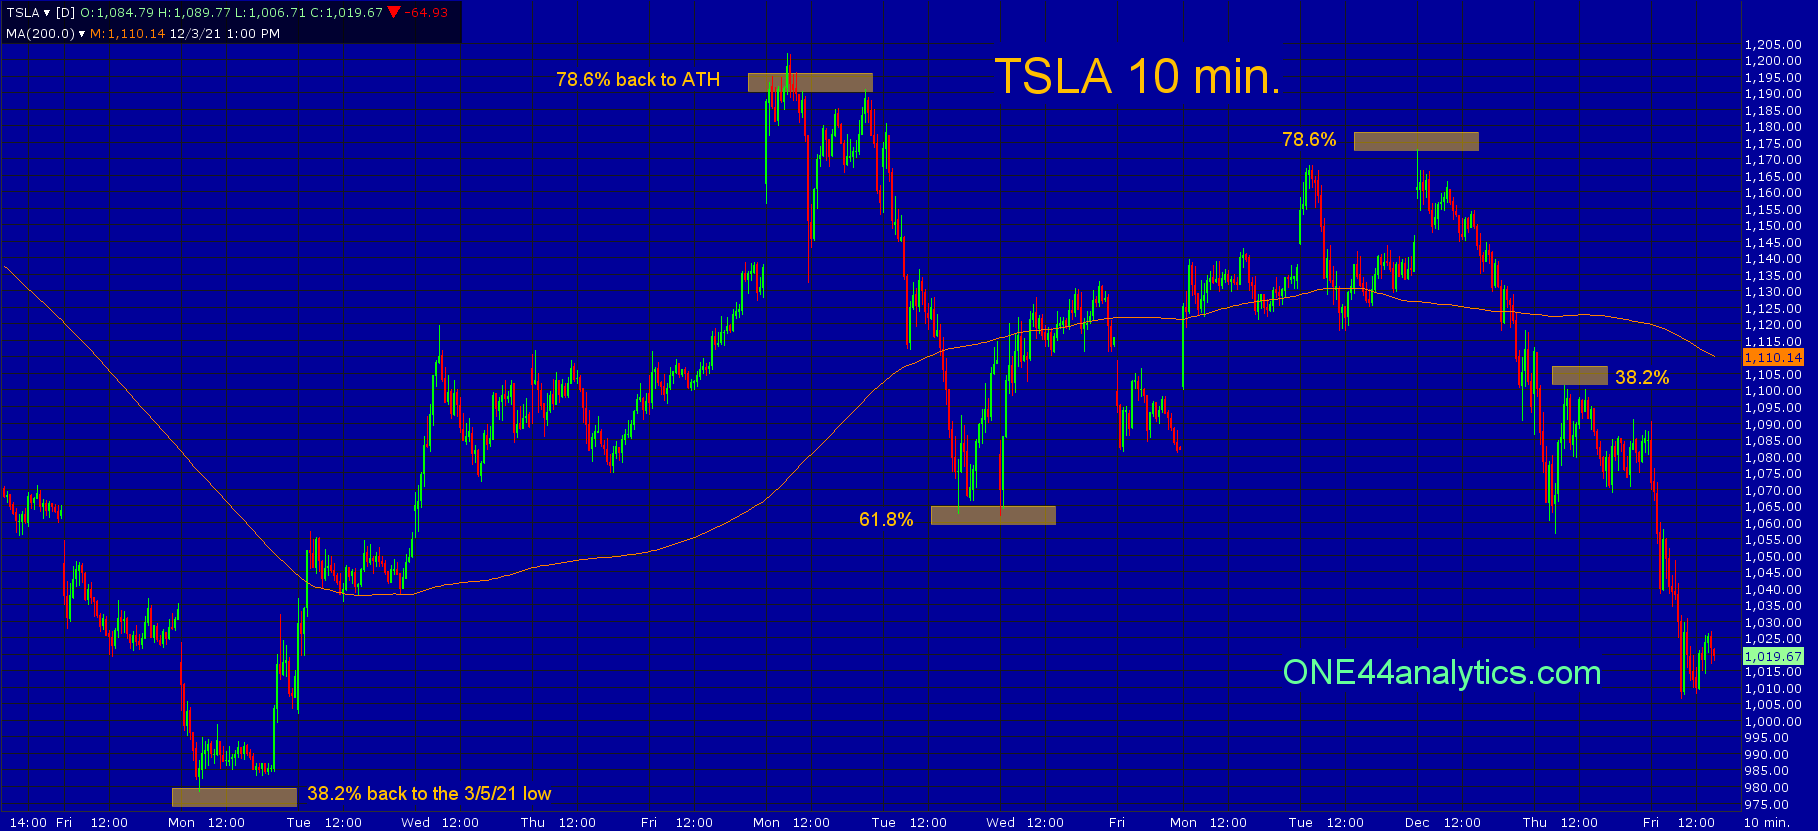
The second chart is a 10 minute bar chart, this is to show you that the retracements work on all scales. In between 38.2% (979.00) back to the 3/5/21 low from the ATH and 78.6% (1188.00) back to the ATH, the high and low before hitting the 1028.00 target were two more retracements. The first was 61.8% at 1064.00 and the high at 1172.00 was 78.6%.
Sign up for our Free newsletter here.
FULL RISK DISCLOSURE: Futures trading contains substantial risk and is not for every investor. An investor could potentially lose all or more than the initial investment. Commission Rule 4.41(b)(1)(I) hypothetical or simulated performance results have certain inherent limitations. Unlike an actual performance record, simulated results do not represent actual trading. Also, since the trades have not actually been executed, the results may have under- or over-compensated for the impact, if any, of certain market factors, such as lack of liquidity. Simulated trading programs in general are also subject to the fact that they are designed with the benefit of hindsight. No representation is being made that any account will or is likely to achieve profits or losses similar to those shown. Past performance is not necessarily indicative of future results.