Bitcoin, Long term, Short term, it's all about the Fib's
ONE44 Analytics where the analysis is concise and to the point
Our goal is to not only give you actionable information, but to help you understand why we think this is happening based on pure price analysis with Fibonacci retracements, that we believe are the underlying structure of all markets and Gann squares.
For the ONE44 Fibonacci rules and guidelines to help with this article, go here.
Charts are courtesy of Barchart.com
This is our latest video in an ongoing series of how to use the Fibonacci retracements. Even if you do not trade the market covered, the ONE44 rules and guidelines are the same, as we believe the Fibonacci retracements are the underlying structure of all markets.
https://youtu.be/HEyLVbjvHDg
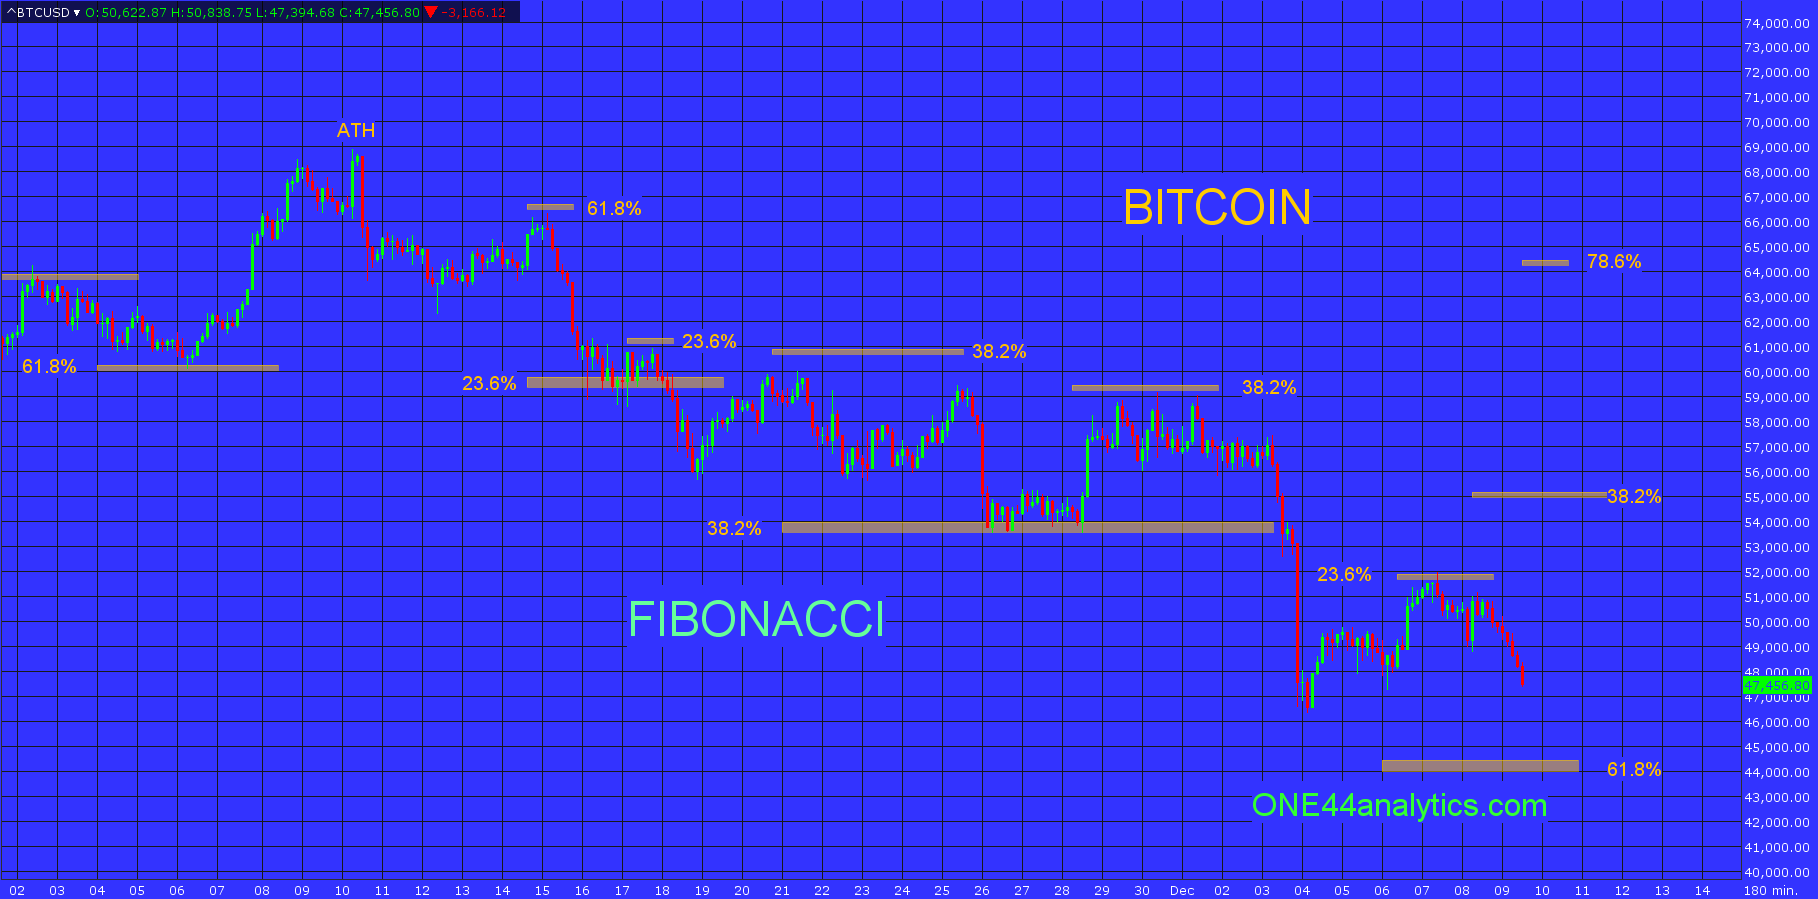
Bitcoin
In our last cryptocurrencies update we took you through the long term Fibonacci retracements and targets and in this post we want to show you how they work on all time scales and markets with the same ONE44 rules and guidelines.
Starting with the ATH the rally after the first break went 61.8% on 11/15/21. The break from it hit 23.6% at 59,400, this should have been able to send it to new highs, however as always we watch all the retracements on every move to see just how weak, or strong the market is regardless of the longer term target. In this case it could only rally 23.6% on 11/17/21 and new lows followed. The next couple rallys from the new lows failed to get up to 38.2% on 11/21/21 and again on 11/25/21, before going to 38.2% back to the 6/22/21 low. This was a very big retracement on 11/26/21 and it needed to go to new highs to keep the longer term trend positive. It failed to do this and was stopped by 38.2% back to the ATH, this was on 11/30/21. It is never a good sign when a shorter term retracement stops a long term trend and target. The break from it took it through 38.2% back to the 6/22/21 low and this sets up a new target of 61.8% at 44,450. The next rally after the huge break over the weekend has hit 23.6% on 12/7/21 showing an even weaker short term trend and just as hitting 38.2% send it to new lows, so should a break from 23.6%. The short term trend remains negative until it can take out 38.2% of the current break, currently this is 55,000.
I hope this shows you the importance of the Fibonacci retracements and that you will make them part of your analysis, guided by the ONE44 rules.
Sign up for our Free newsletter here.
FULL RISK DISCLOSURE: Futures trading contains substantial risk and is not for every investor. An investor could potentially lose all or more than the initial investment. Commission Rule 4.41(b)(1)(I) hypothetical or simulated performance results have certain inherent limitations. Unlike an actual performance record, simulated results do not represent actual trading. Also, since the trades have not actually been executed, the results may have under- or over-compensated for the impact, if any, of certain market factors, such as lack of liquidity. Simulated trading programs in general are also subject to the fact that they are designed with the benefit of hindsight. No representation is being made that any account will or is likely to achieve profits or losses similar to those shown. Past performance is not necessarily indicative of future results.