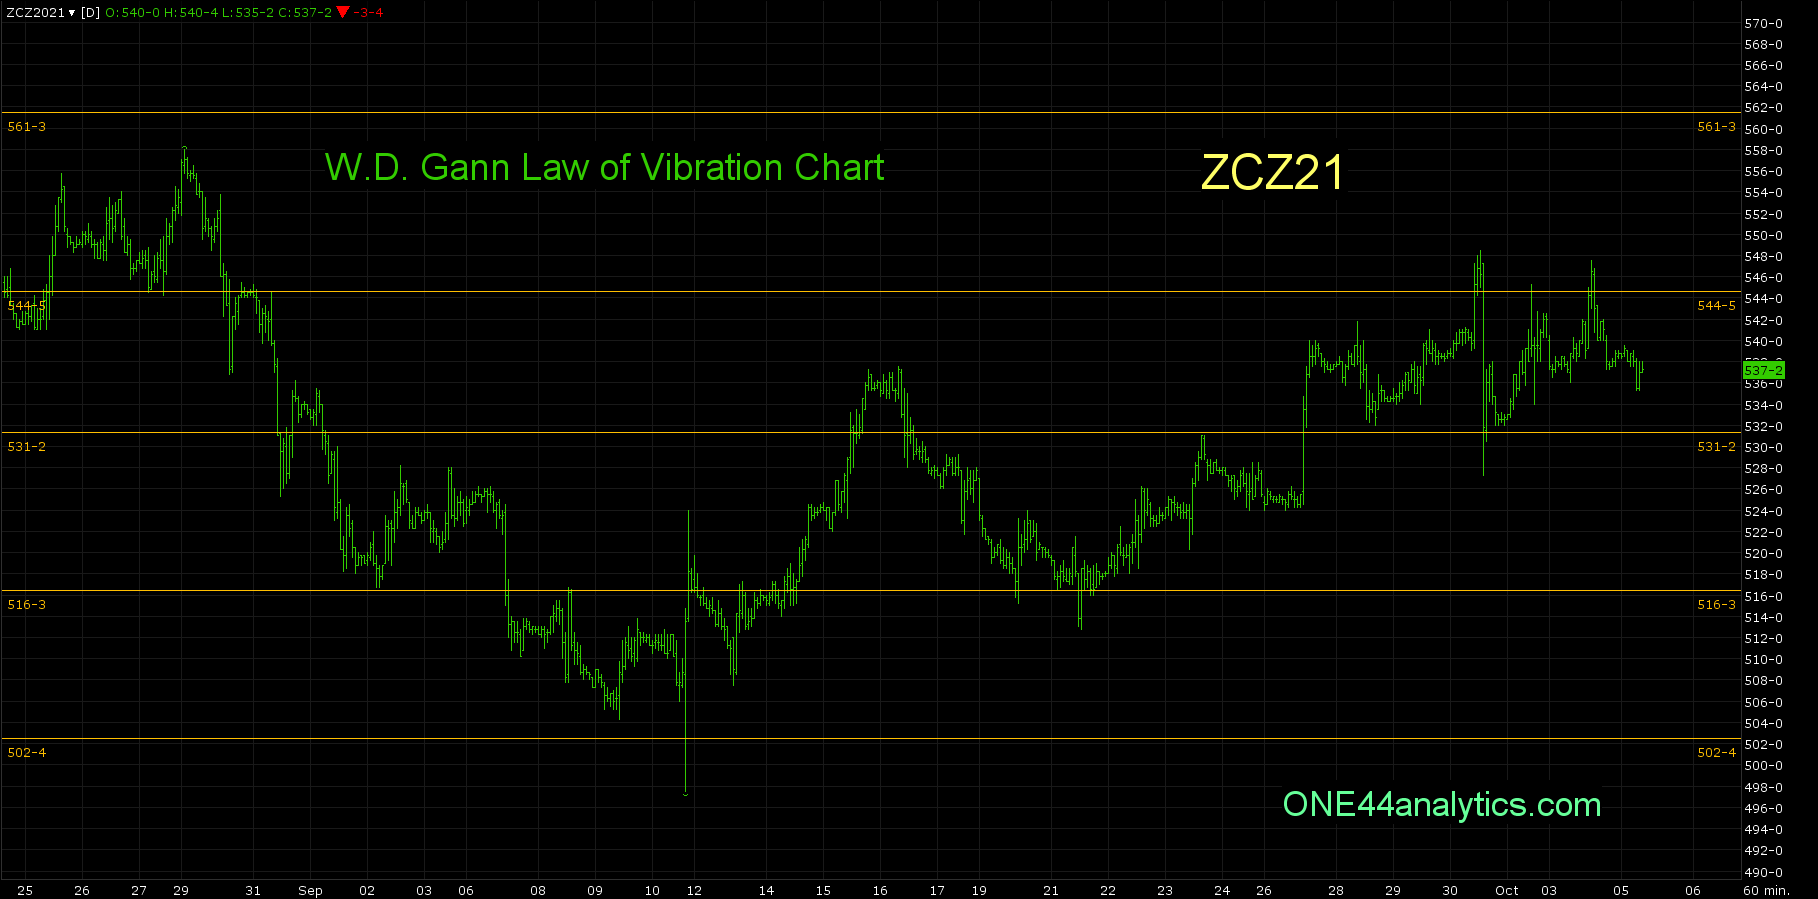
Corn, Fibonacci and Gann
ONE44 Analytics where the analysis is concise and to the point
Our goal is to not only give you actionable information, but to help you understand why we think this is happening based on pure price analysis with Fibonacci retracements and Gann squares.
The Charts below are short term natural support and resistance levels that are based on W.D.Gann's "Law of Vibration" and Fibonacci.
Each level can be used as support and then resistance once taken out and the reverse when starting as resistance. These levels will be good until the end of each contract. These charts are updated each day on our website under 'GRAINS".
You can find our long term views on these markets posted on Barchart.com, or the ONE44 website.
Charts are courtesy of Barchart.com
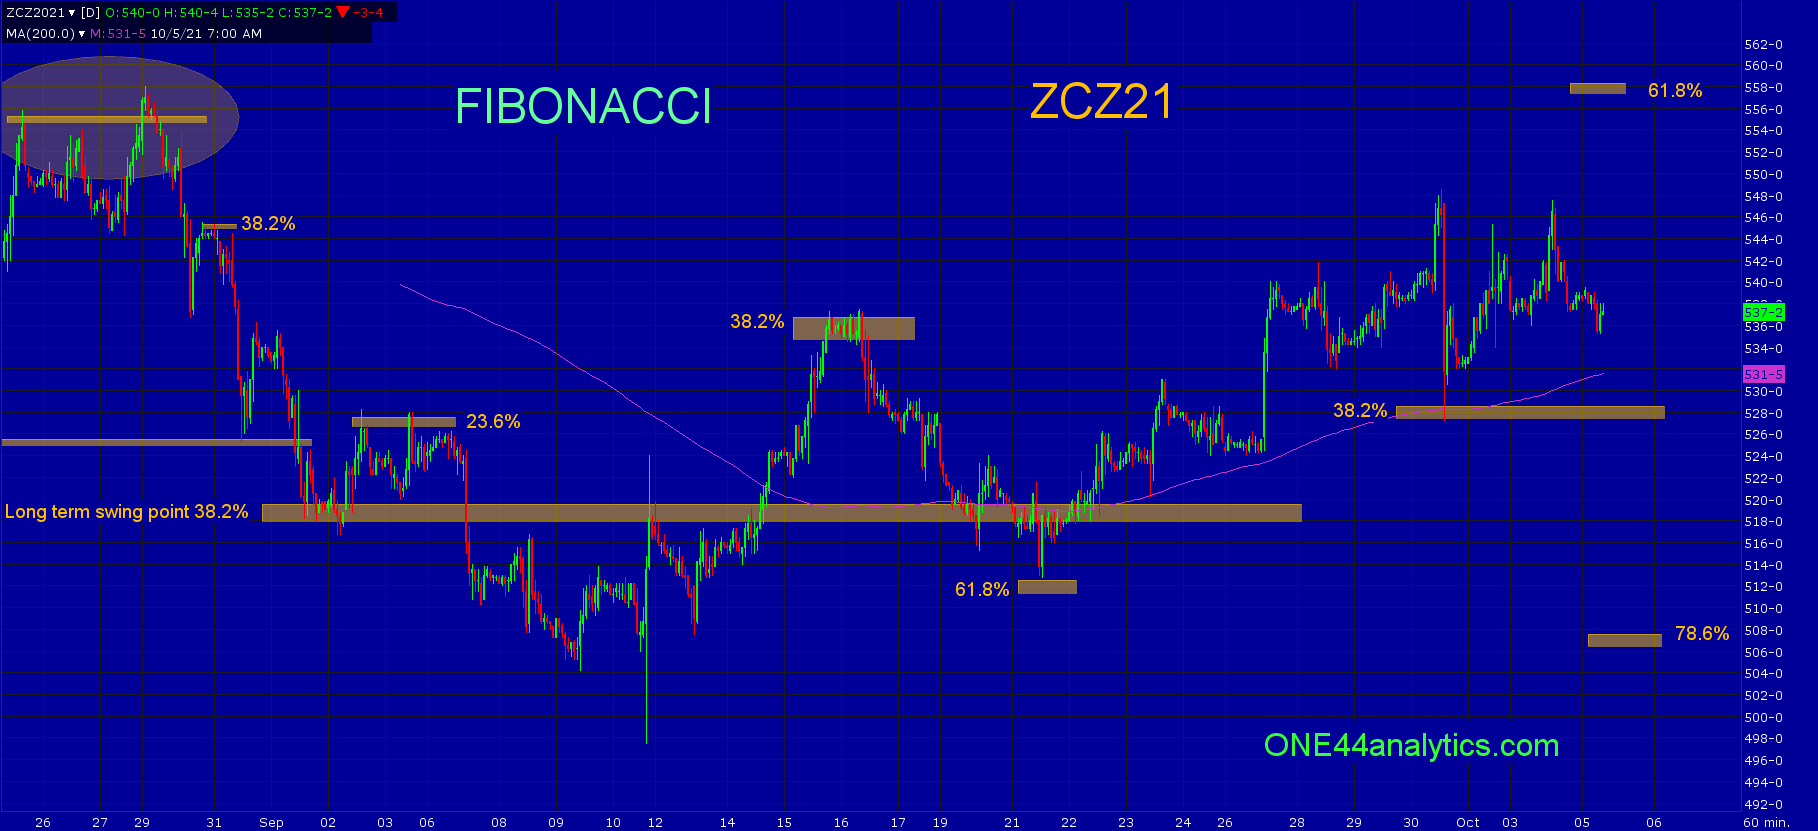
You can get all the rules and guidelines to the Fibonacci retracements on our website
Sign up for our Free newsletter here.
FULL RISK DISCLOSURE: Futures trading contains substantial risk and is not for every investor. An investor could potentially lose all or more than the initial investment. Commission Rule 4.41(b)(1)(I) hypothetical or simulated performance results have certain inherent limitations. Unlike an actual performance record, simulated results do not represent actual trading. Also, since the trades have not actually been executed, the results may have under- or over-compensated for the impact, if any, of certain market factors, such as lack of liquidity. Simulated trading programs in general are also subject to the fact that they are designed with the benefit of hindsight. No representation is being made that any account will or is likely to achieve profits or losses similar to those shown. Past performance is not necessarily indicative of future results.