Grains
Daily support and resistance
ONE44 static sup/res charts
The Charts below are natural support and resistance levels that are based on W.D.Gann "Law of Vibration".
Mr Gann viewed stocks as live electrons, atoms, and molecules which hold persistently to their own individuality in response to the fundamental Law of Vibration. Science teaches 'that an original impulse of any kind finally resolves itself into periodic or rhythmical motion, also just as the pendulum returns again in its swing, just as the moon returns in its orbit, just as the advancing year ever brings the rise or spring, so do the properties of the elements periodically recur as the weight of the atoms rises'.
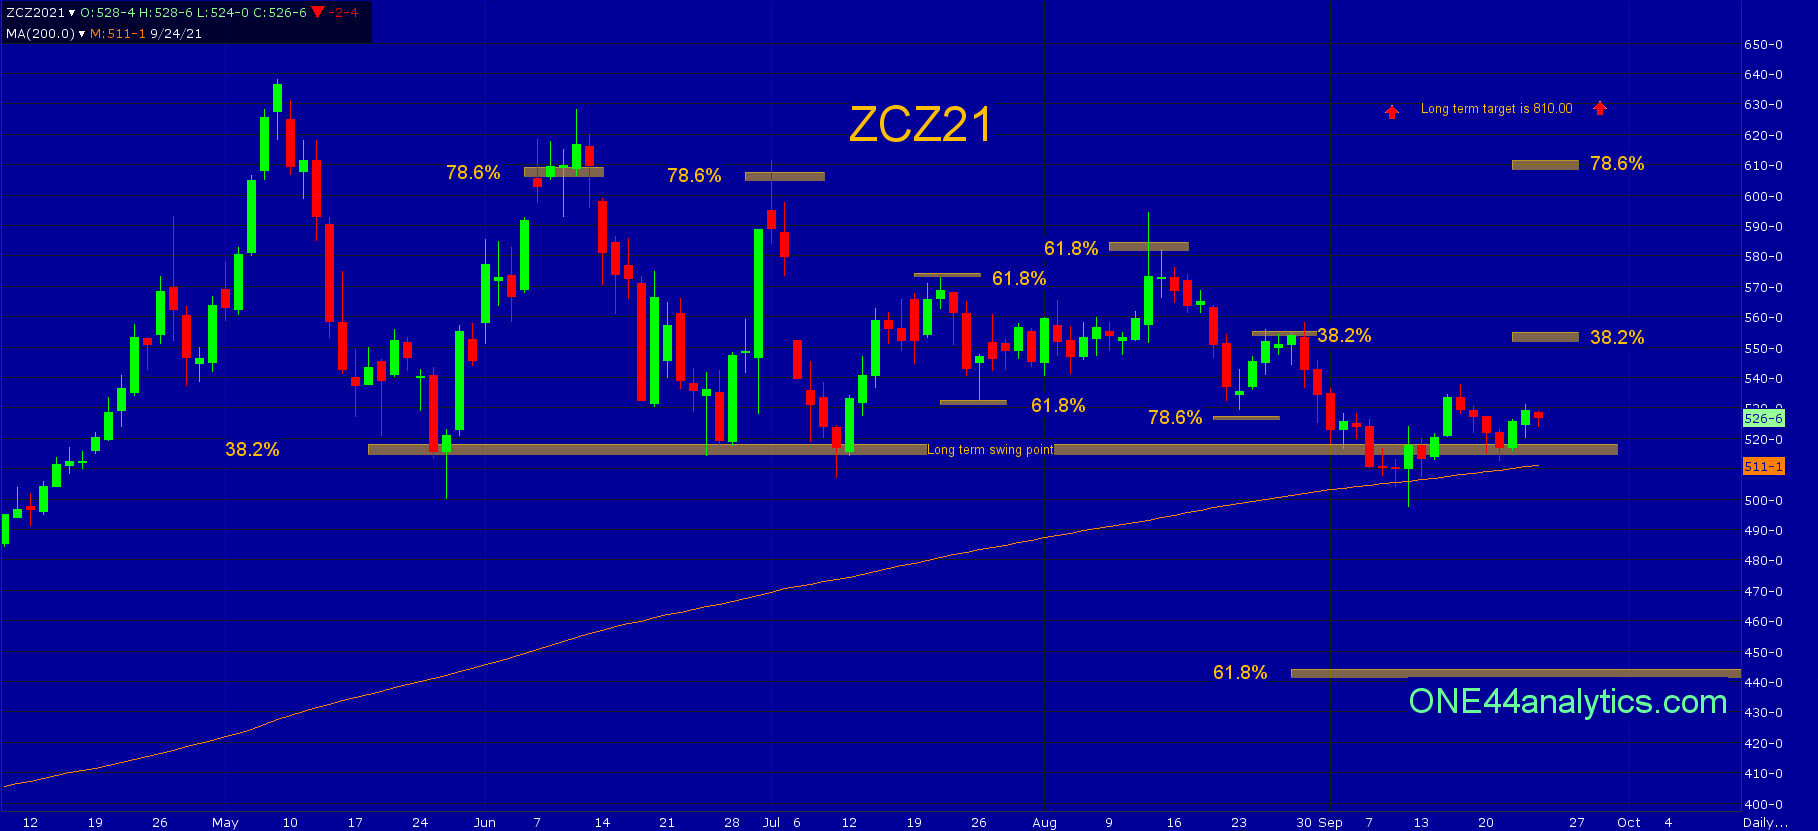
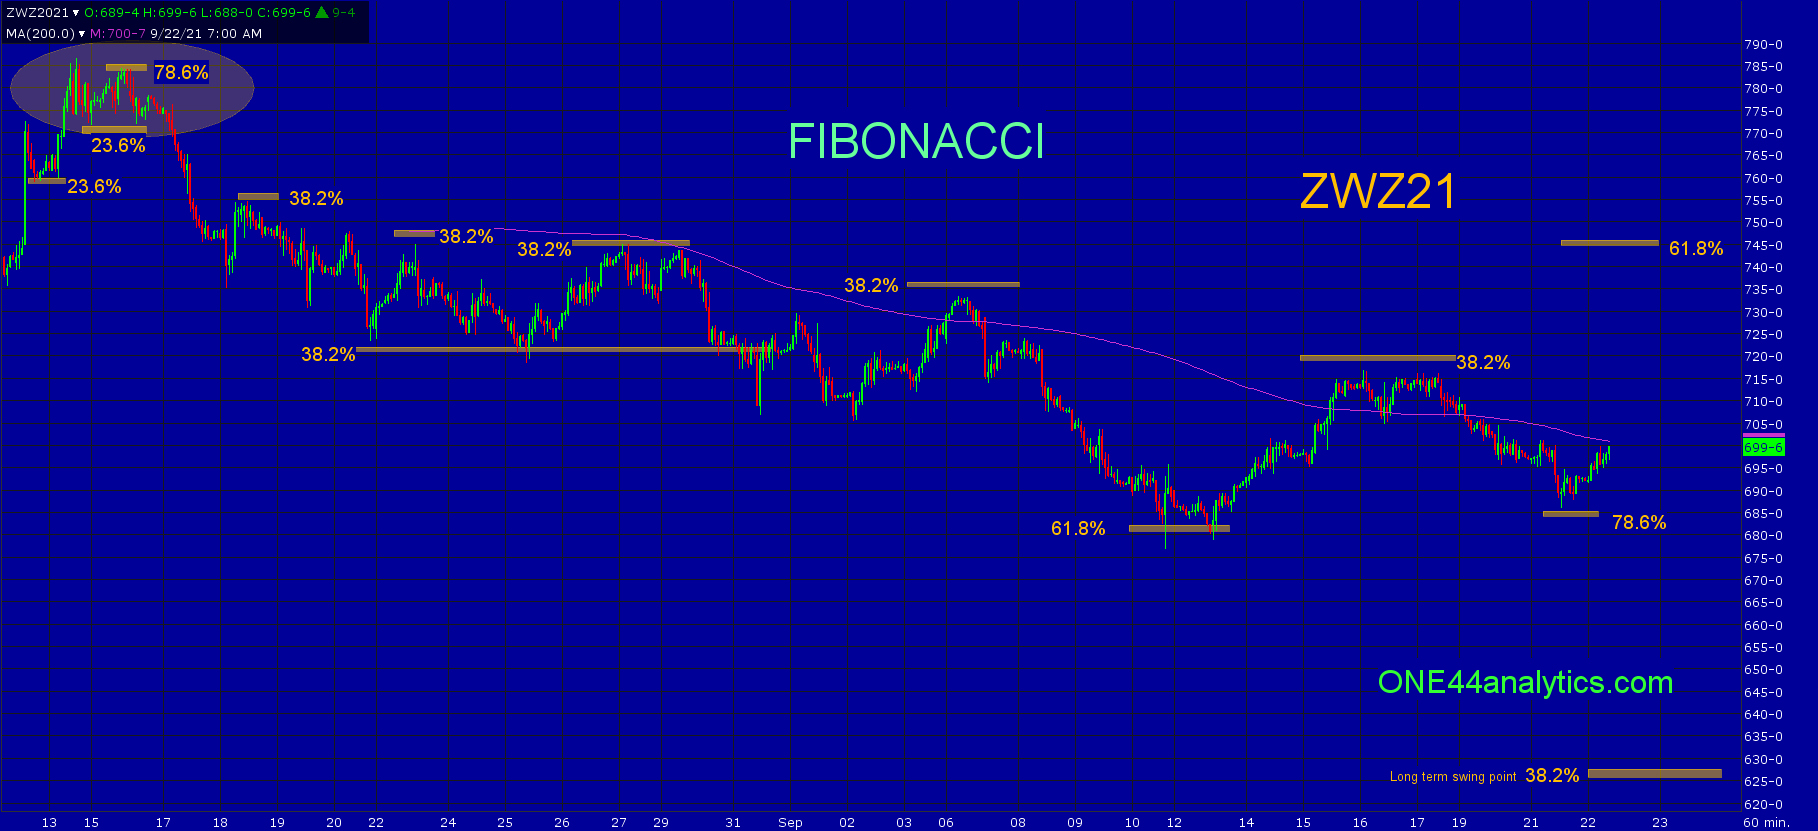
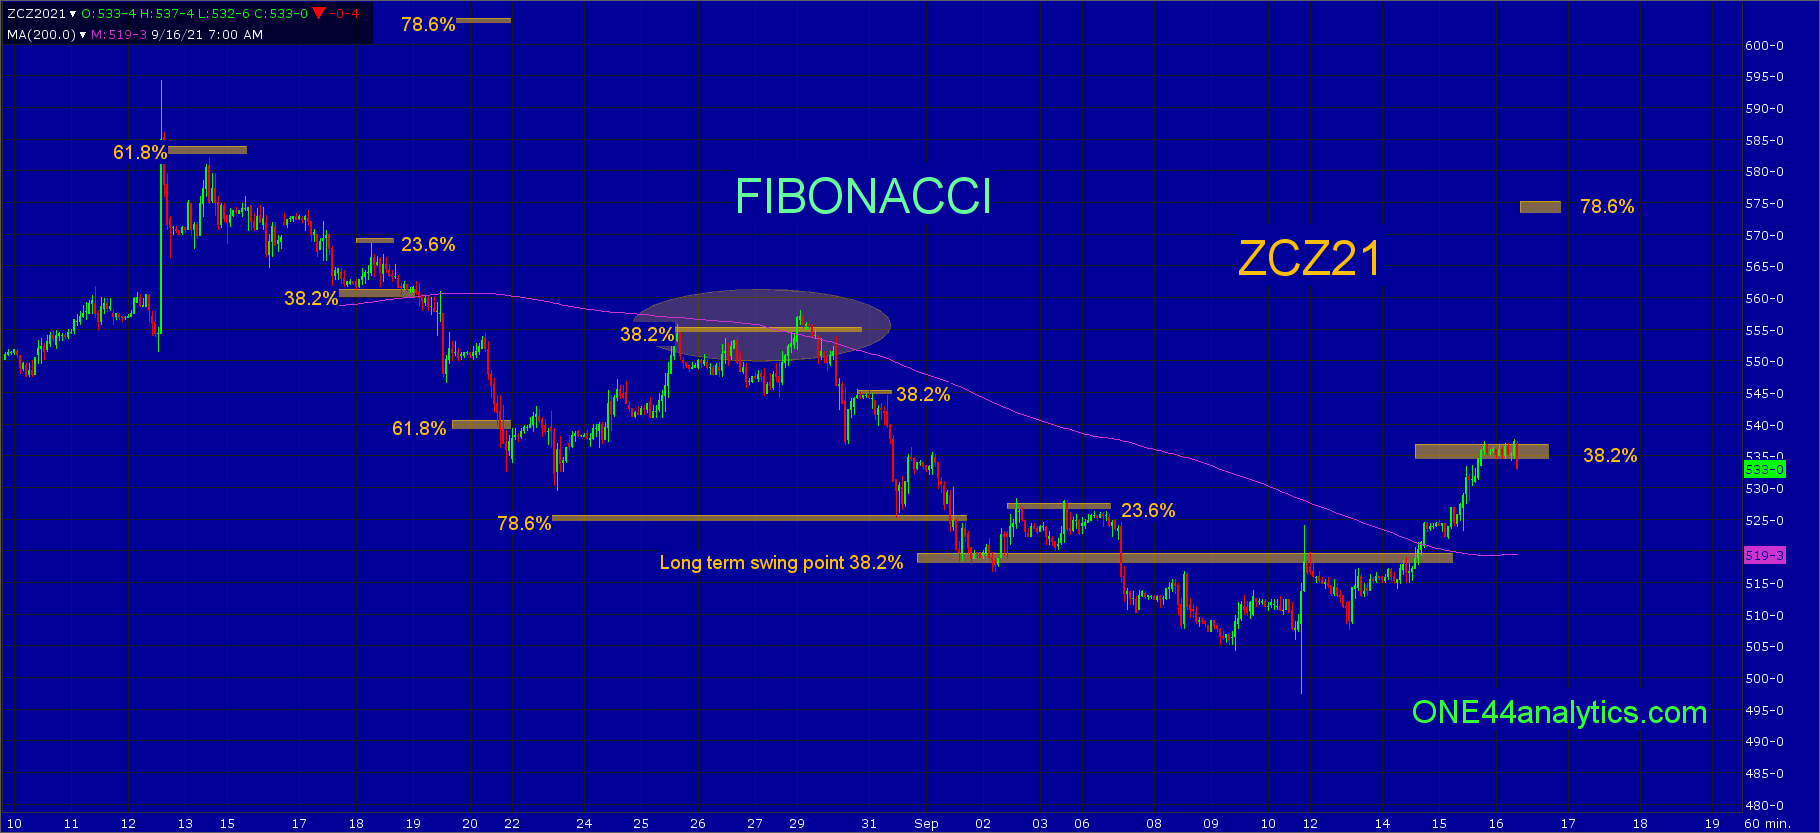
There are also charts that have the Fibonacci retracements on them for support/resistance and to determine the trend, short and long term.


11/19/21


11/18/21


11/17/21


11/16/21


11/15/21


11/12/21
New post above


11/11/21


11/10/21


11/8/21


11/5/21


11/4/21


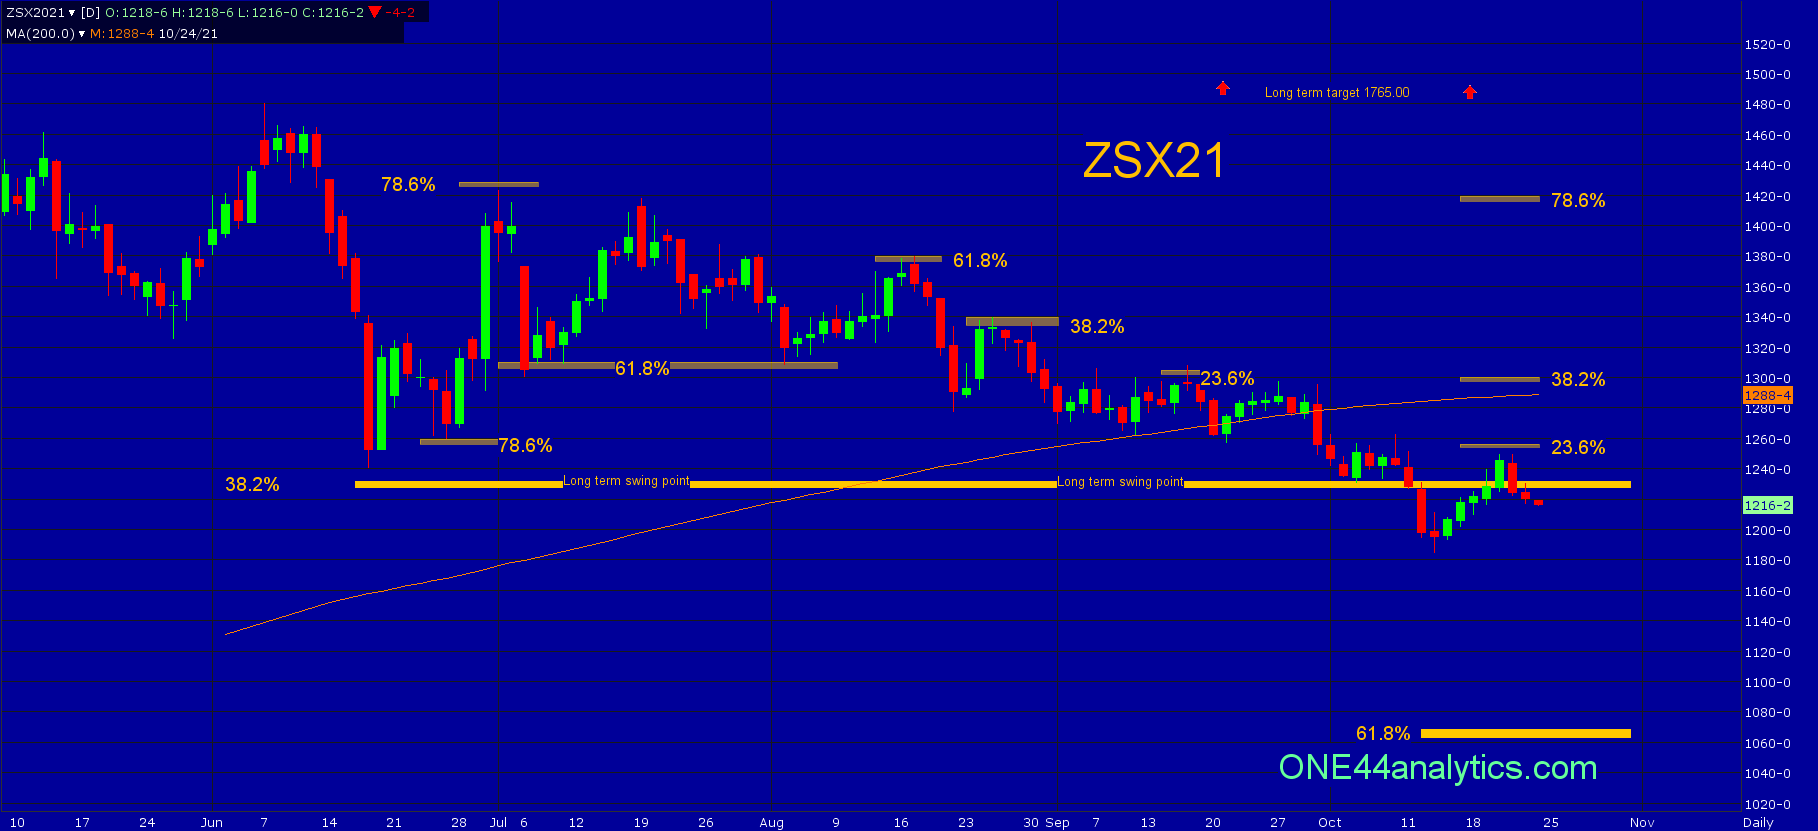
11/3/21


11/2/21


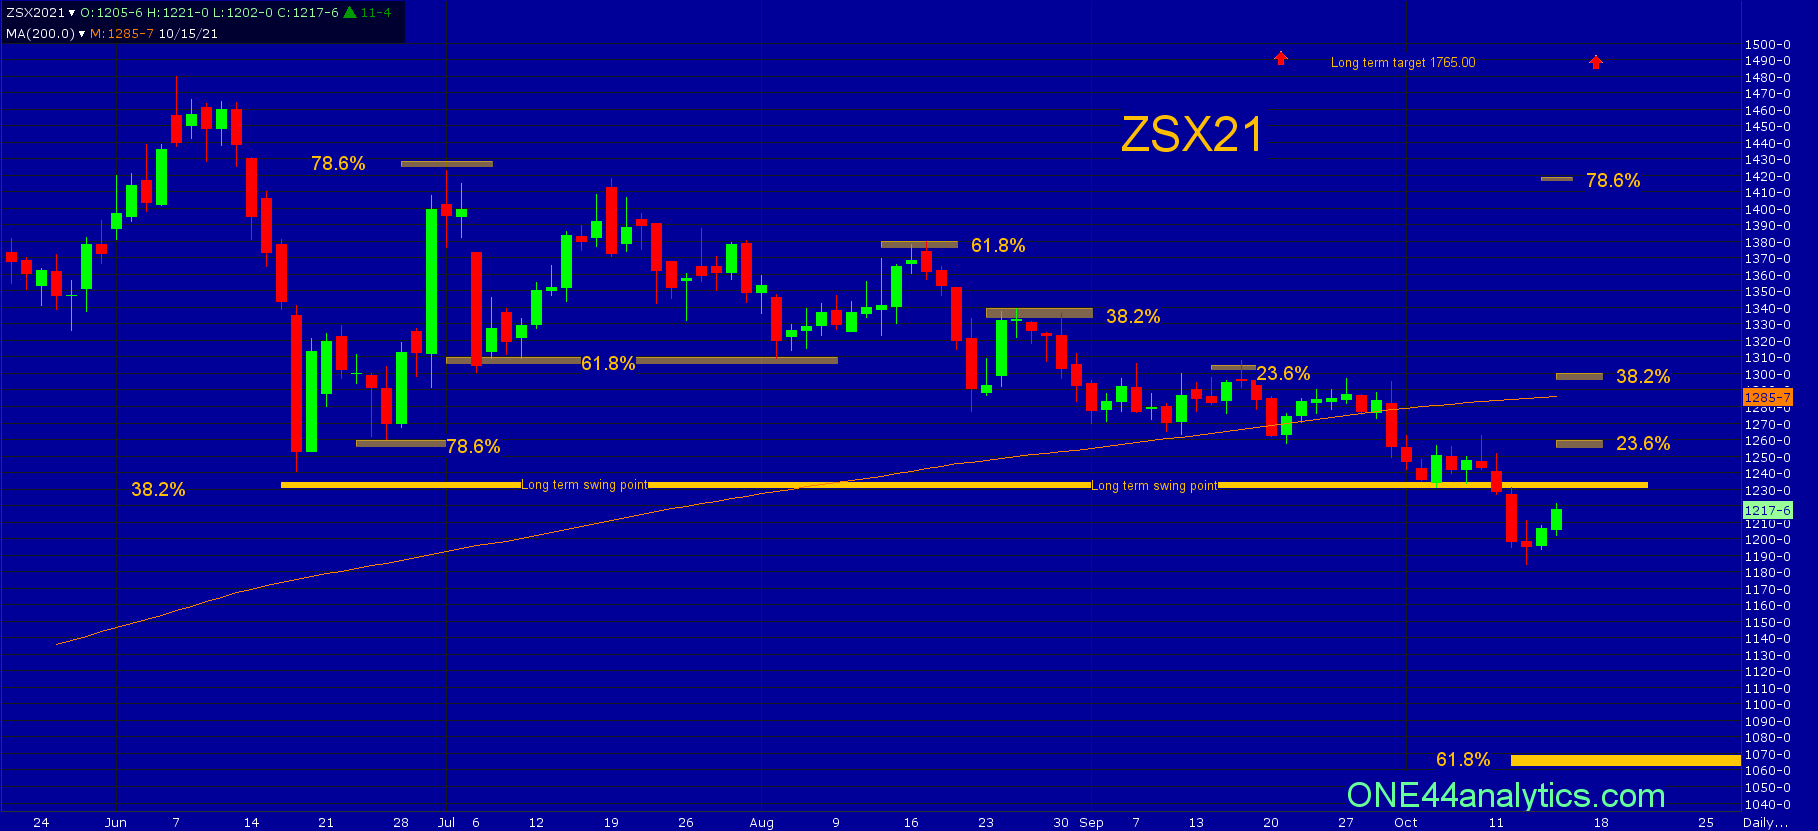
11/2/21


11/1/21


10/29/21


10/28/21


10/27/21


10/26/21


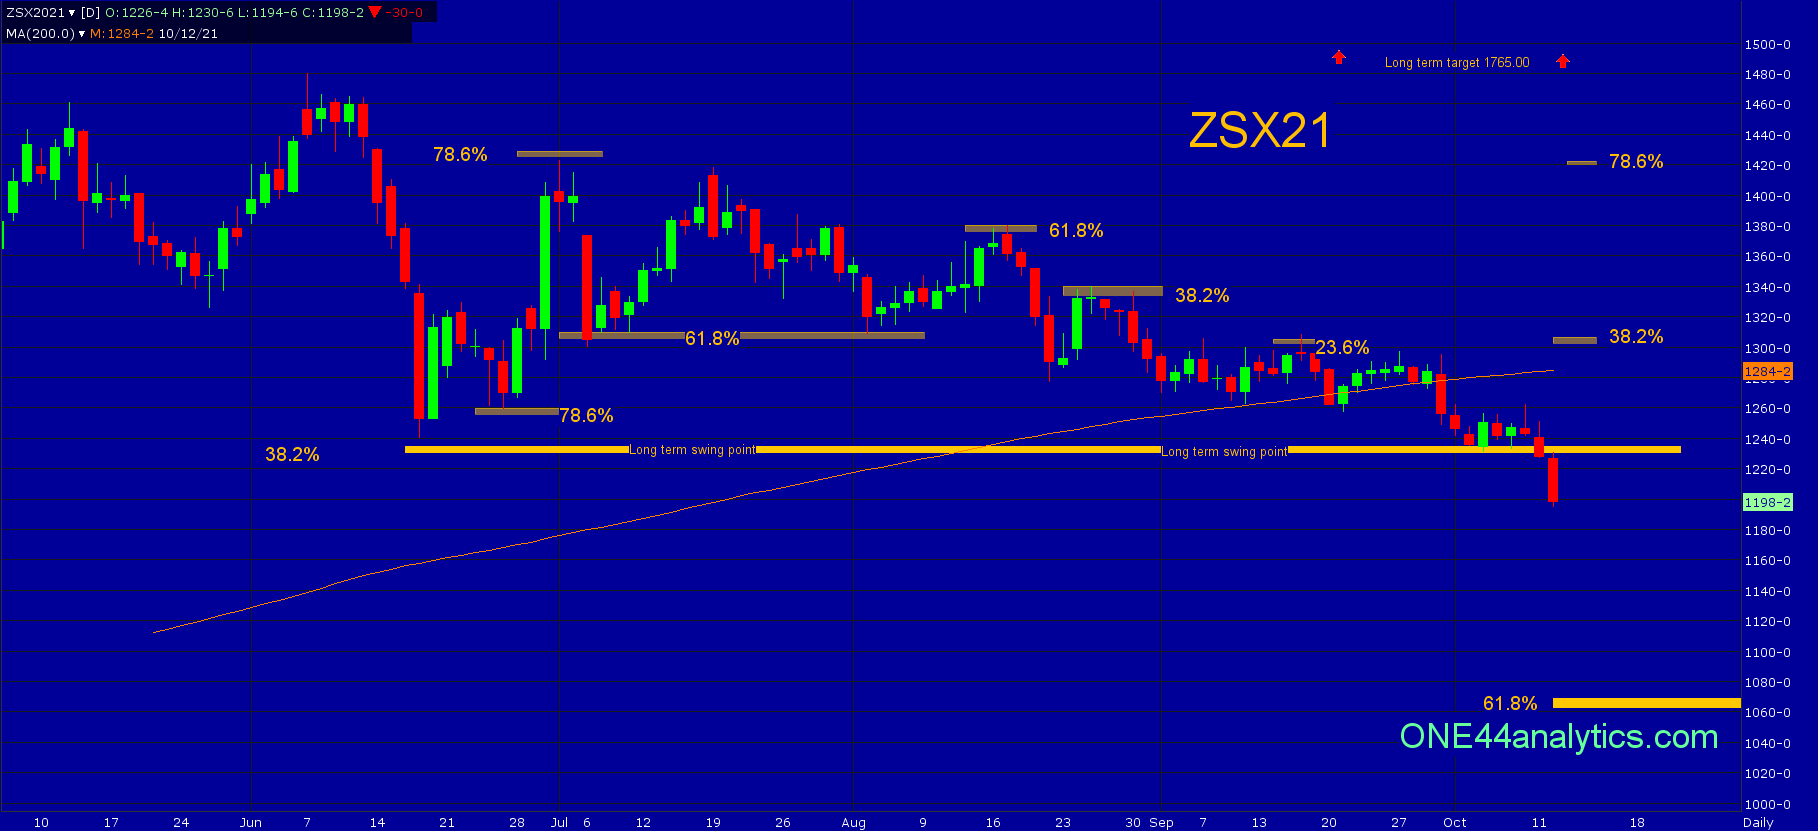
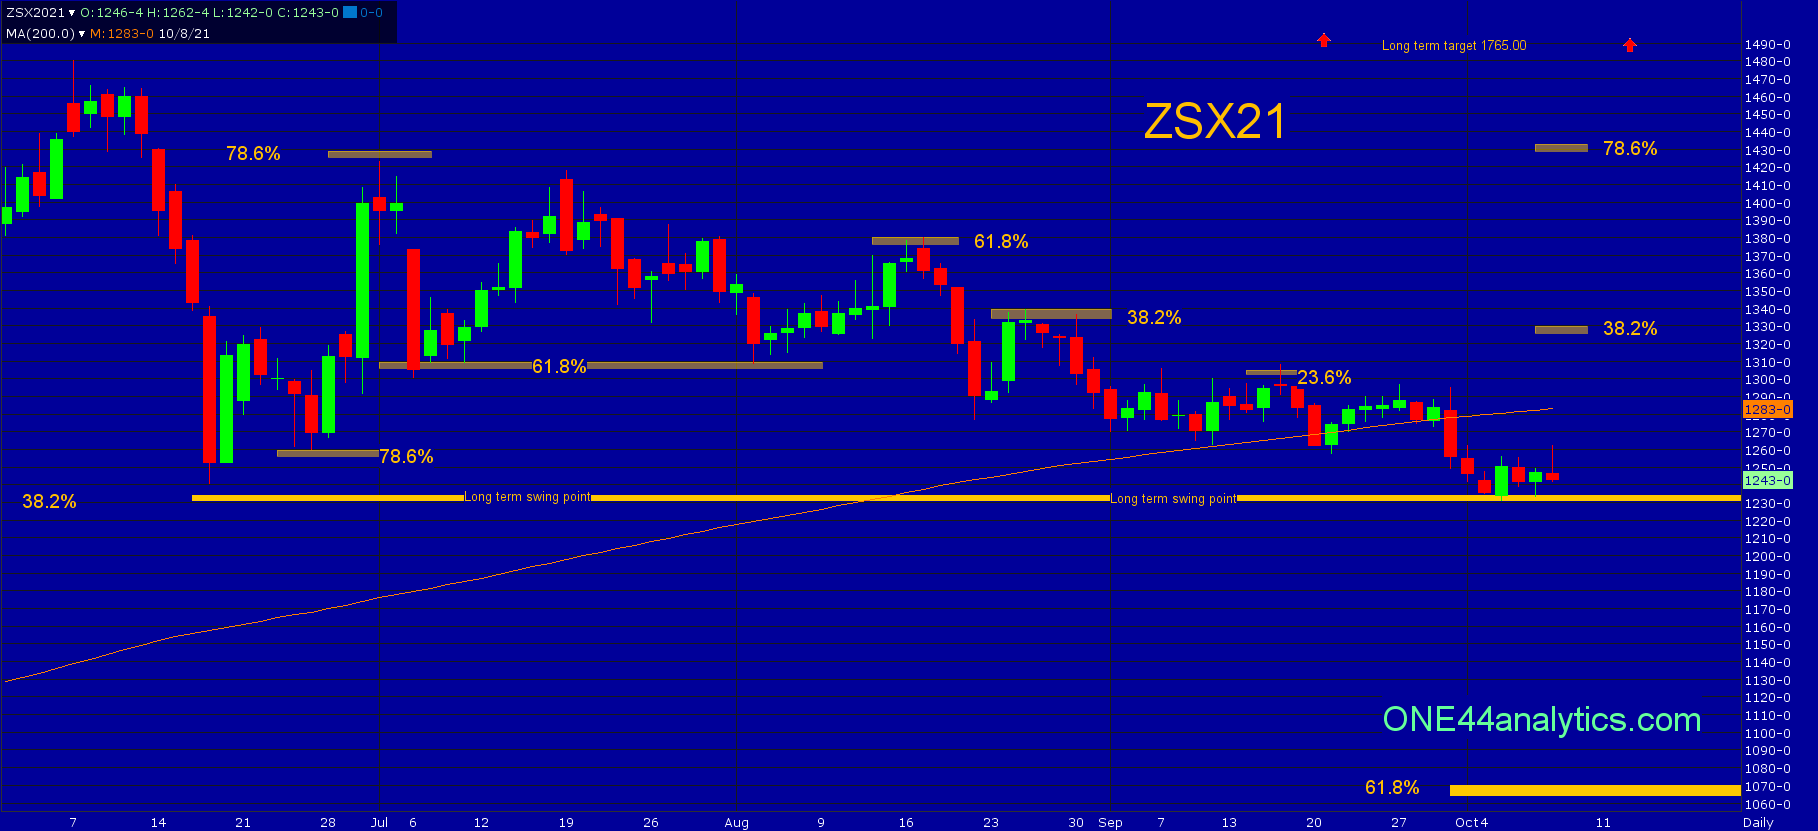
10/22/21


10/20/21


10/19/21


10/17/21


10/14/21


10/13/21


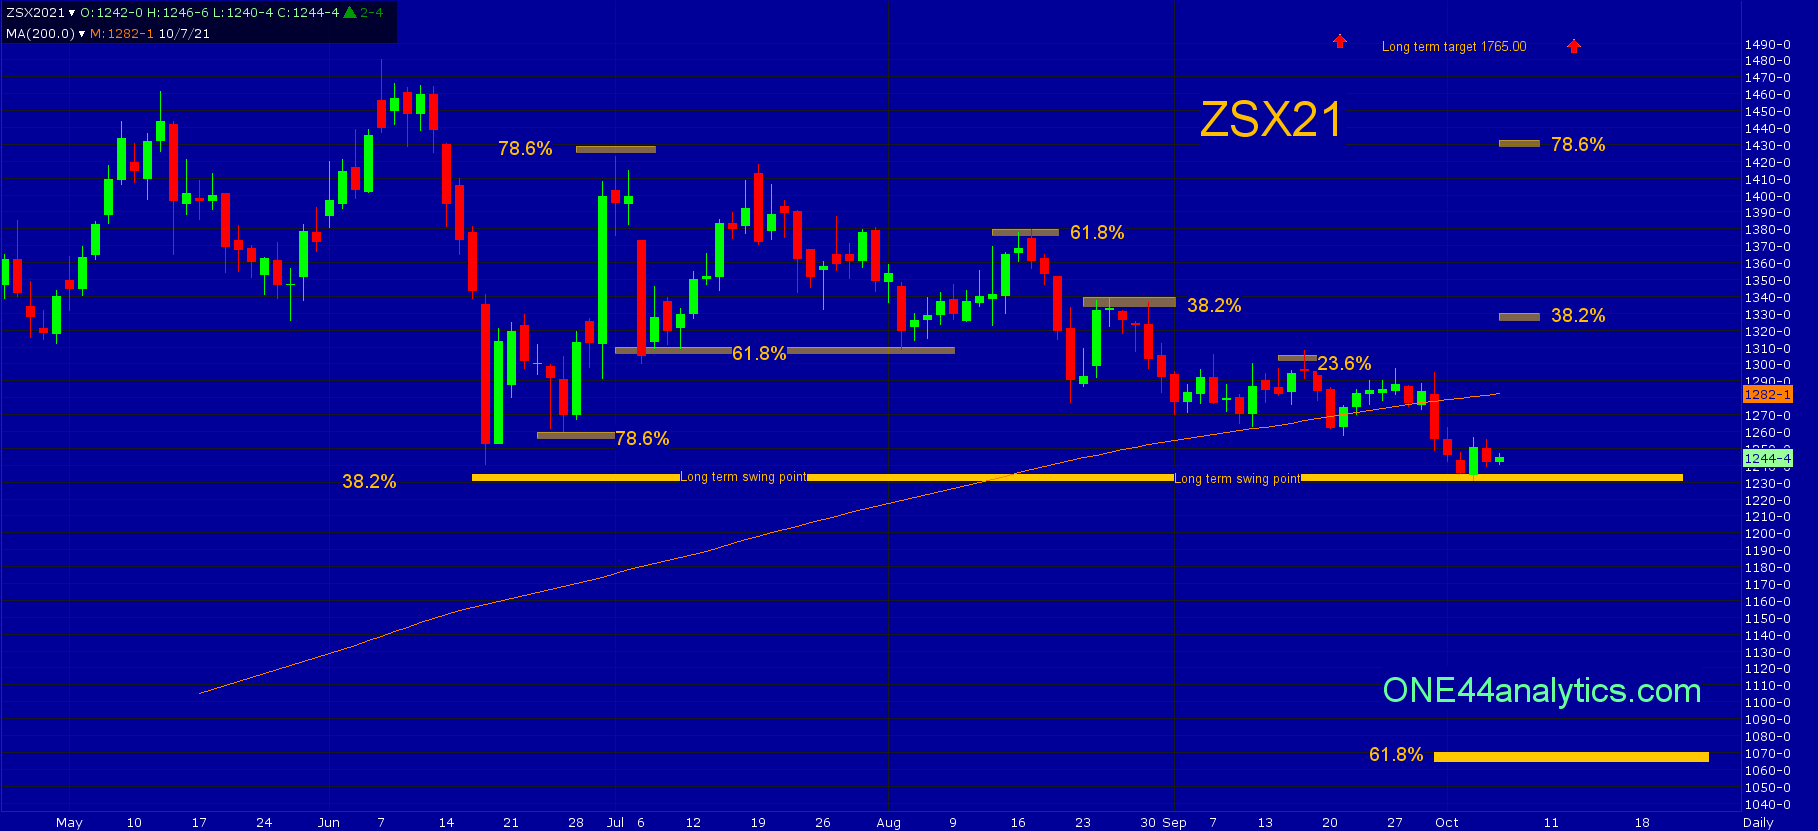
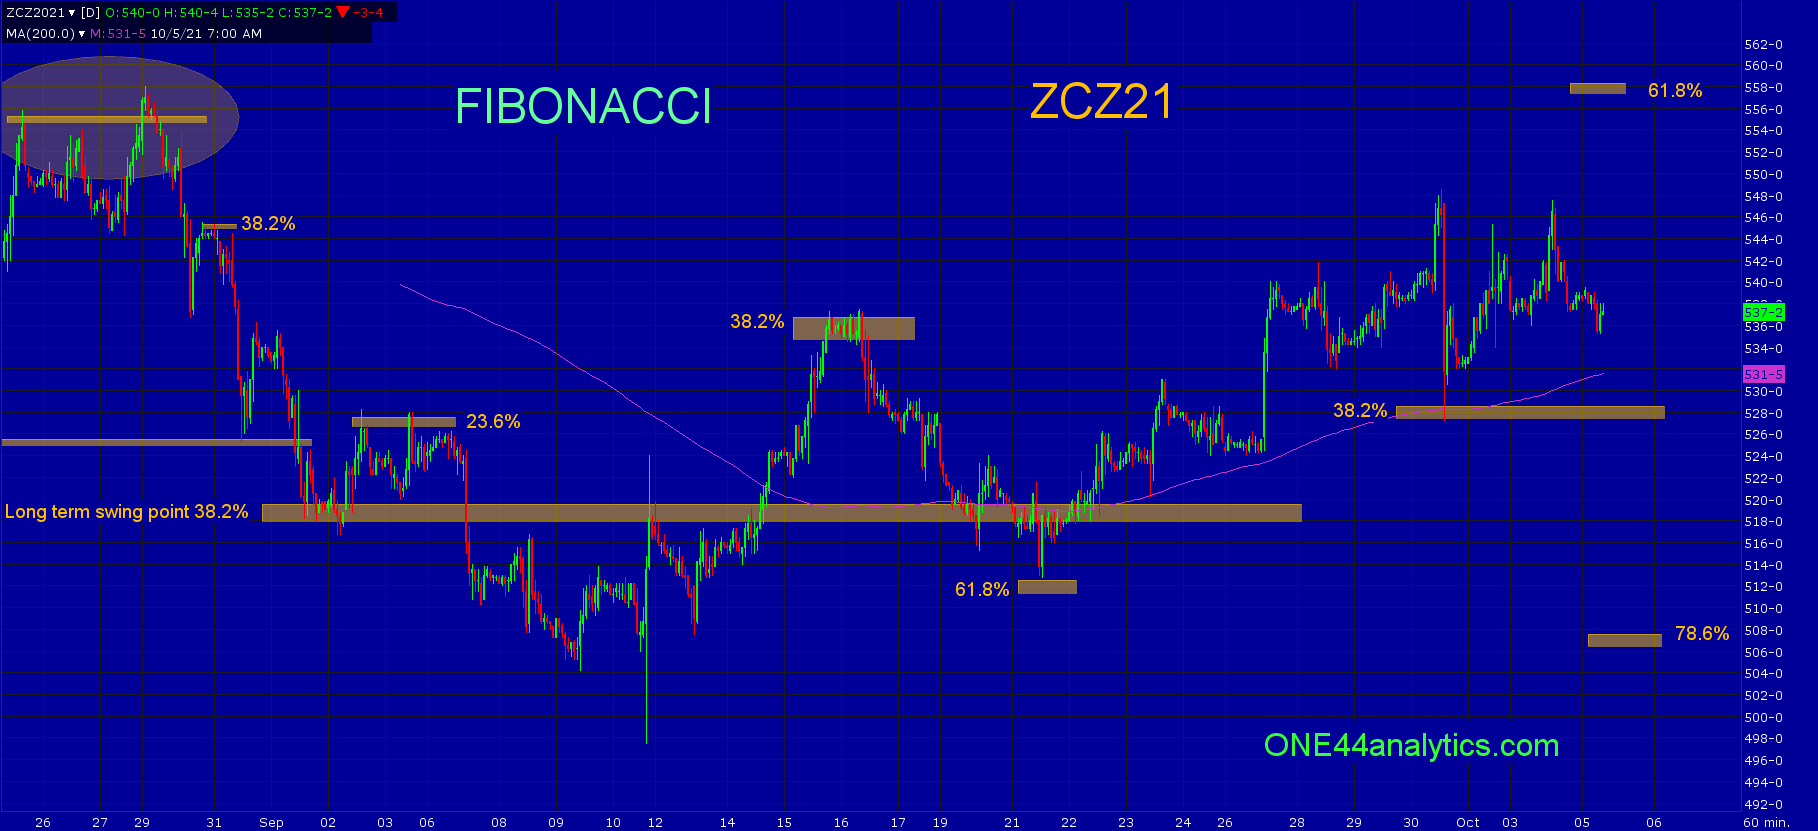
10/12/21


10/11/21


10/8/21


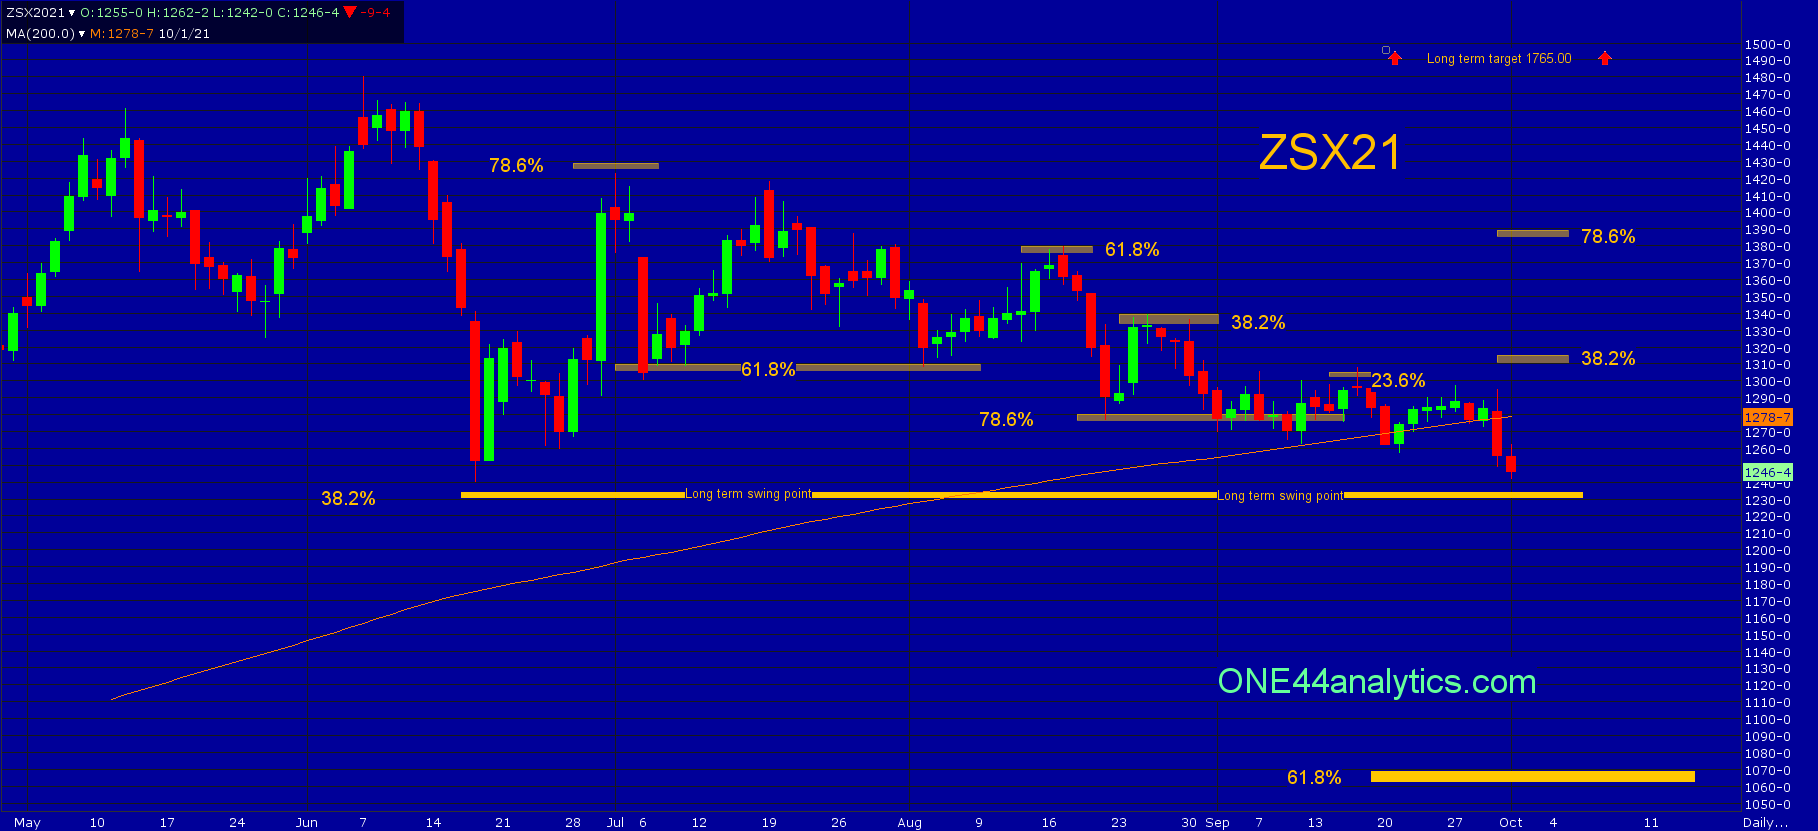
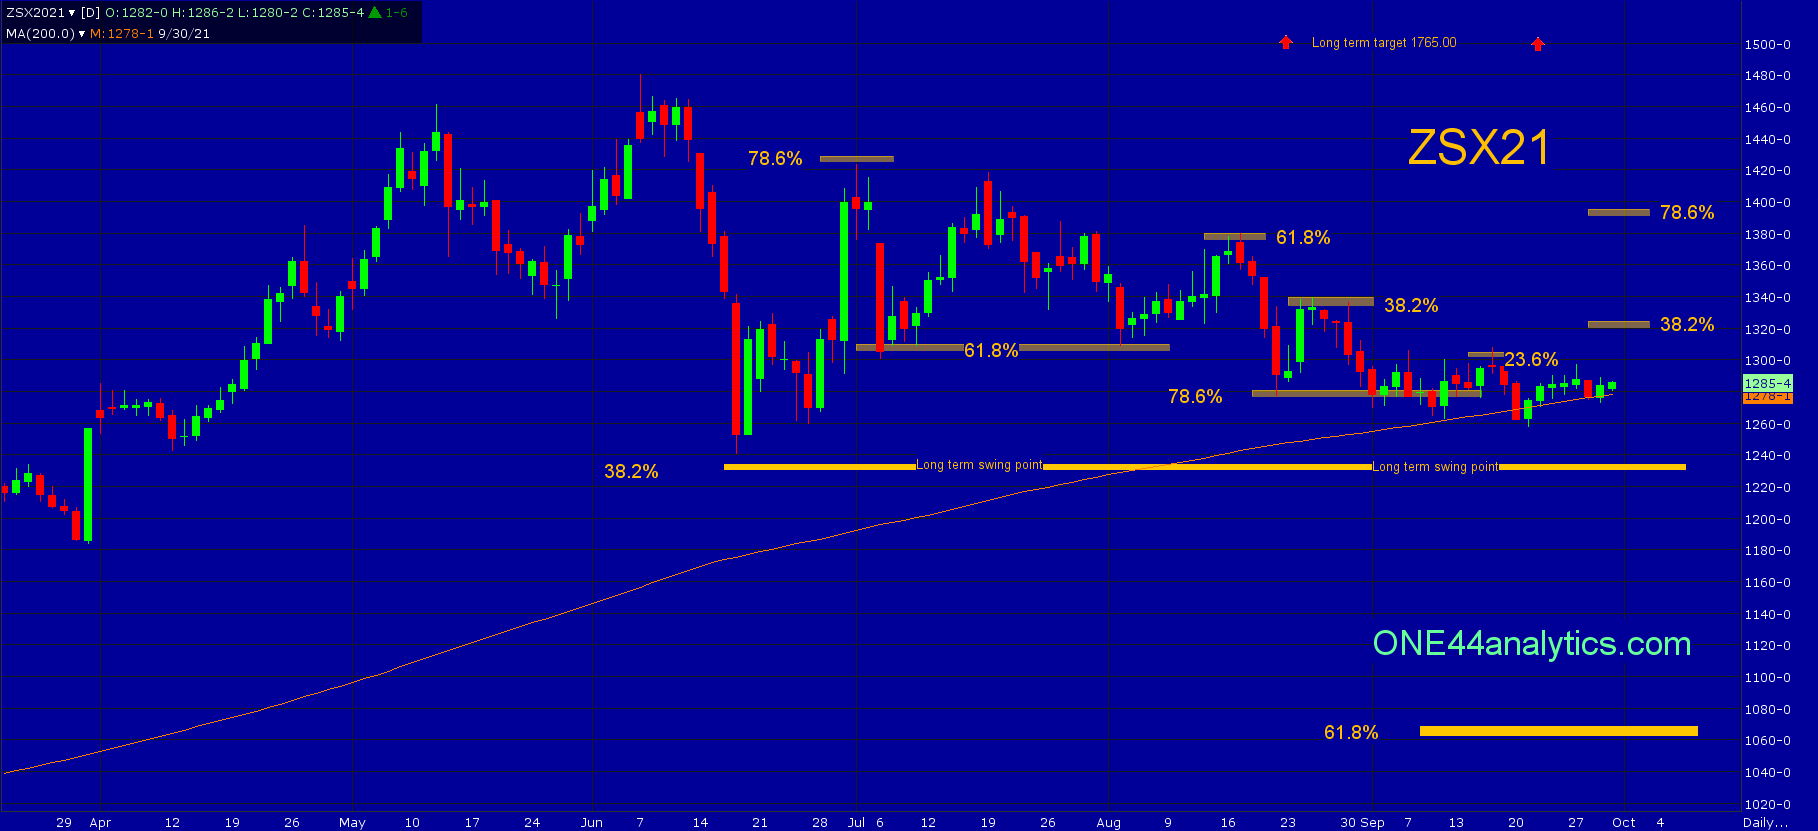
10/7/21


10/6/21


10/5/21


10/4/21


10/1/21


9/30/21


9/29/21


9/28/21


9/27/21


9/24/21


9/23/21


9/22/21


9/21/21




9/20/21


9/17/21


9/16/21


9/15/21


9/14/21


9/13/21


9/10/21


9/9/21


9/8/21


9/7/21


9/3/21


9/2/21


9/1/21


8/31/21


8/30/21


8/27/21


8/26/21


8/25/21


8/24/21


8/23/21


8/20/21


8/19/21


8/17/21


8/16/21


8/12/21


8/10/21


8/2/21


6/6/21


4/12/21


4/6/21


3/29/21


3/18/21


2/28/21


2/4/21


1/25/21


1/21/21


1/12/21


1/7/21


12/27/20


12/4/20


11/18/20

11/17/20

11/9/20

11/2/20

10/27/20

10/21/20

1016/20

10/14/20

10/11/20

10/8/20

10/6/20

10/2/20

9/2/20 8:05 am

9/24/20 7:51 am

9/23/20 7:51 am

9/21/20 8:10 am
ONE44 static sup/res chart

9/17/20 7:40 am
ONE44 static sup/res chart

9/16/20 7:40 am
ONE44 static sup/res chart,

9/15/20 8:30 am
ZSF20 DSP 1004.00, above it look for 1020.50, below it they go for 988.00
ONE44 static sup/res chart,


