Corn is at the crossroads
ONE44 Analytics where the analysis is concise and to the point
Our goal is to not only give you actionable information, but to help you understand why we think this is happening based on pure price analysis with Fibonacci retracements, that we believe are the underlying structure of all markets and Gann squares.
Here is a quick set of guidelines for the Fibonacci retracements to help with this article. You can find all the rules/guidelines and examples on any deviations from these four basic rules on our website.
1) The Golden rule, any market that is going to continue the current trend must hold 38.2% and a new high/low should follow.
2) Markets that are extremely strong/weak will only go 23.6% and a new high/low should follow. Typically a runaway market.
3) The 61.8% rule is, any market that holds 61.8% should go 61.8% of where it just came from. Usual happens when a market is directionless, or in a consolidation period.
4) The 78.6% rule is, any market that holds 78.6% should go 78.6% of where it just came from. This is also where a lot of Bull markets end and start.
Corn is at the crossroads.
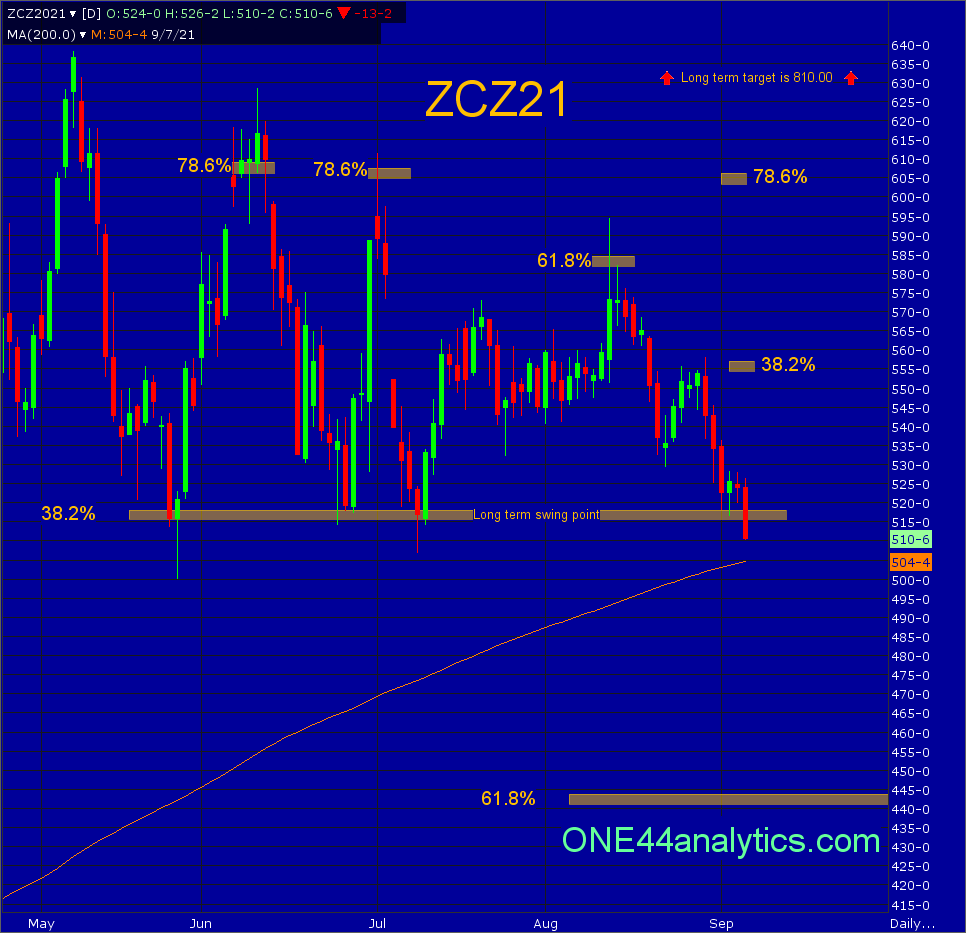
Today's close was below the long term swing point of 518.00, this is 38.2% of the contract high and low. It has been here three other times, the first was on 5/25/21, the second on 6/24/21 and the third on 7/9/21. All of them produced big rallies. Following the ONE44 Fibonacci 38.2% rule, this is the level that must hold to keep the trend positive.
There still may be hope for the long side of the market. We always want to see two close's below a major retracement to consider it violated. Tomorrow's close will be key to see if the rally resumes, or they go for 61.8% at 445.00.
Here is what to look for, the 200 day moving average is at 504.50, if they trade down to it, or even through it and close back above 518.00 they may have dodged a bullet. With this happening, look for a rally back to 78.6% at 605.00, any rally from this area that only goes 38.2%, (this is currently 555.00 with today's low) would be a negative sign.
Provided it did get another lower close tomorrow, we would also want to see it close below the 200 day moving average at 504.5, if so, look for 61.8%. This would also put the idea we had back in the fall of 2020 that this was going to be a multi year rally on hold and that the next six months could be a wide trading range of 61.8% to 61.8%.
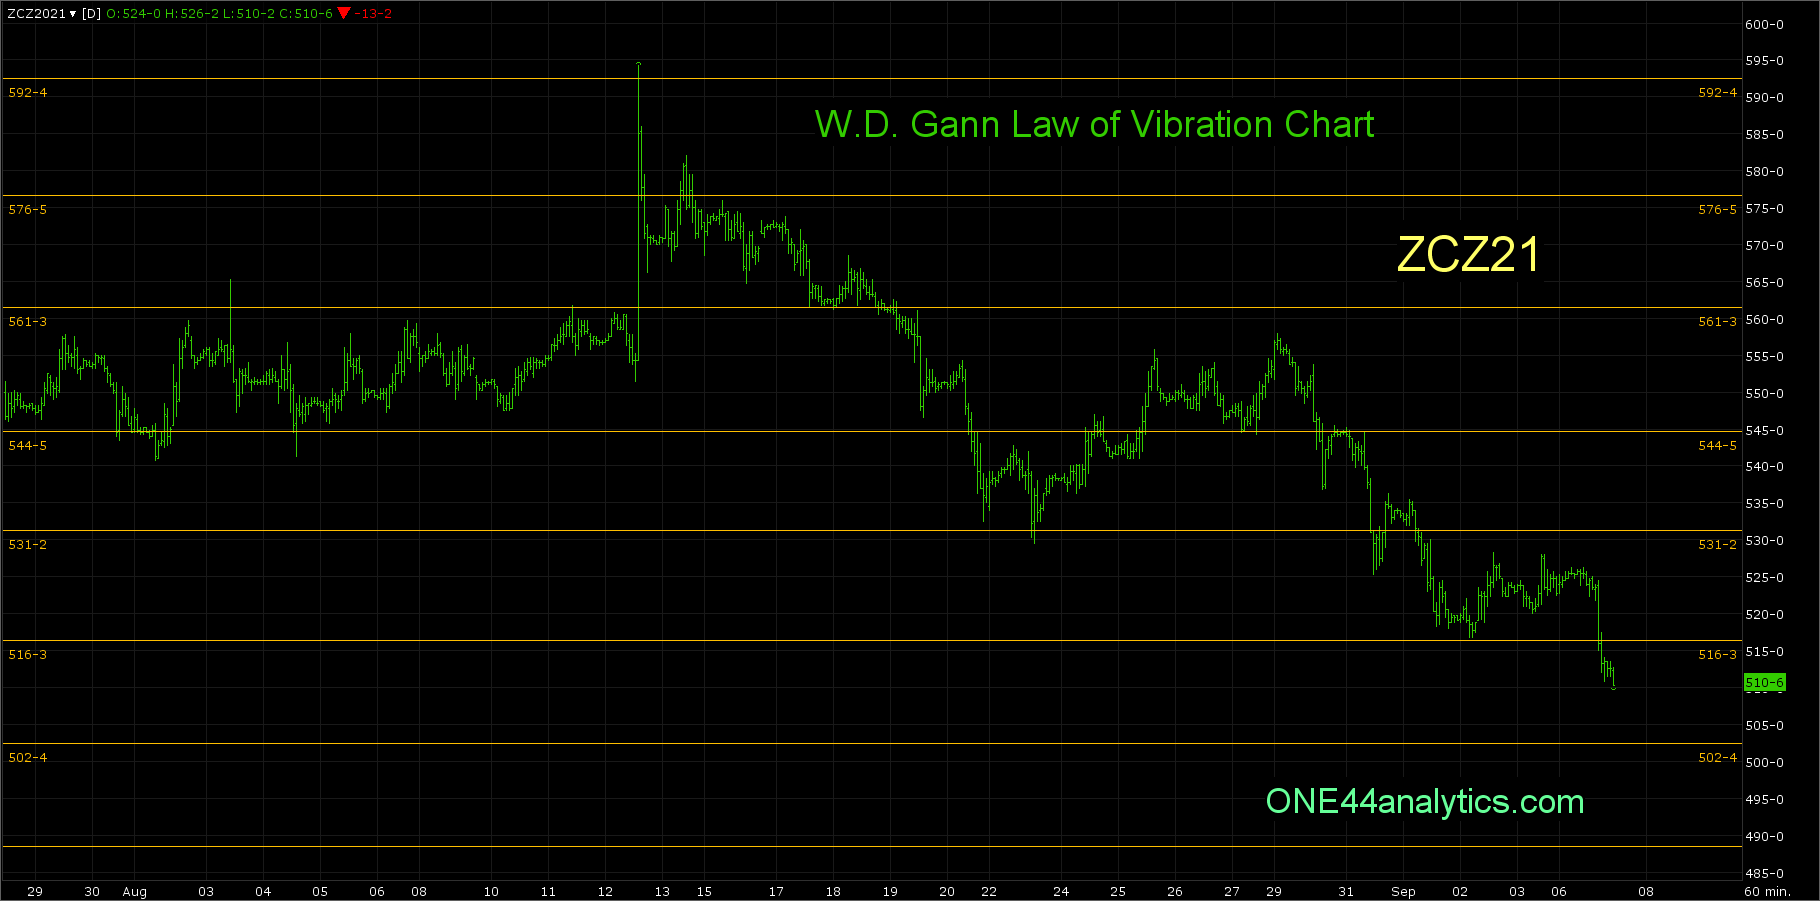
You can get our daily Gann "Law of Vibration" and Fibonacci charts on Grains for FREE on our website at the top of the page.
Sign up for our Free newsletter here.
FULL RISK DISCLOSURE: Futures trading contains substantial risk and is not for every investor. An investor could potentially lose all or more than the initial investment. Commission Rule 4.41(b)(1)(I) hypothetical or simulated performance results have certain inherent limitations. Unlike an actual performance record, simulated results do not represent actual trading. Also, since the trades have not actually been executed, the results may have under- or over-compensated for the impact, if any, of certain market factors, such as lack of liquidity. Simulated trading programs in general are also subject to the fact that they are designed with the benefit of hindsight. No representation is being made that any account will or is likely to achieve profits or losses similar to those shown. Past performance is not necessarily indicative of future results.