Crude Oil /Gold Update
CLJ21
This week's high of 63.81 fell just short of the 64.00 long term target, this is a major Gann square and 78.6% back to the 10/1/18 high. The first place to look for support on a break from this area is 57.20, this is 23.6% back to the 11/2/20 low. Next would be 38.2% of the same low at 52.90, just below this is a major Gann square at 52.50. The long term swing point has now moved up to 47.40. With a couple solid close's above 64.00 the next long term target is 78.00.

For shorter term support and resistance you can use the "Law of Vibration" chart below.

Gold
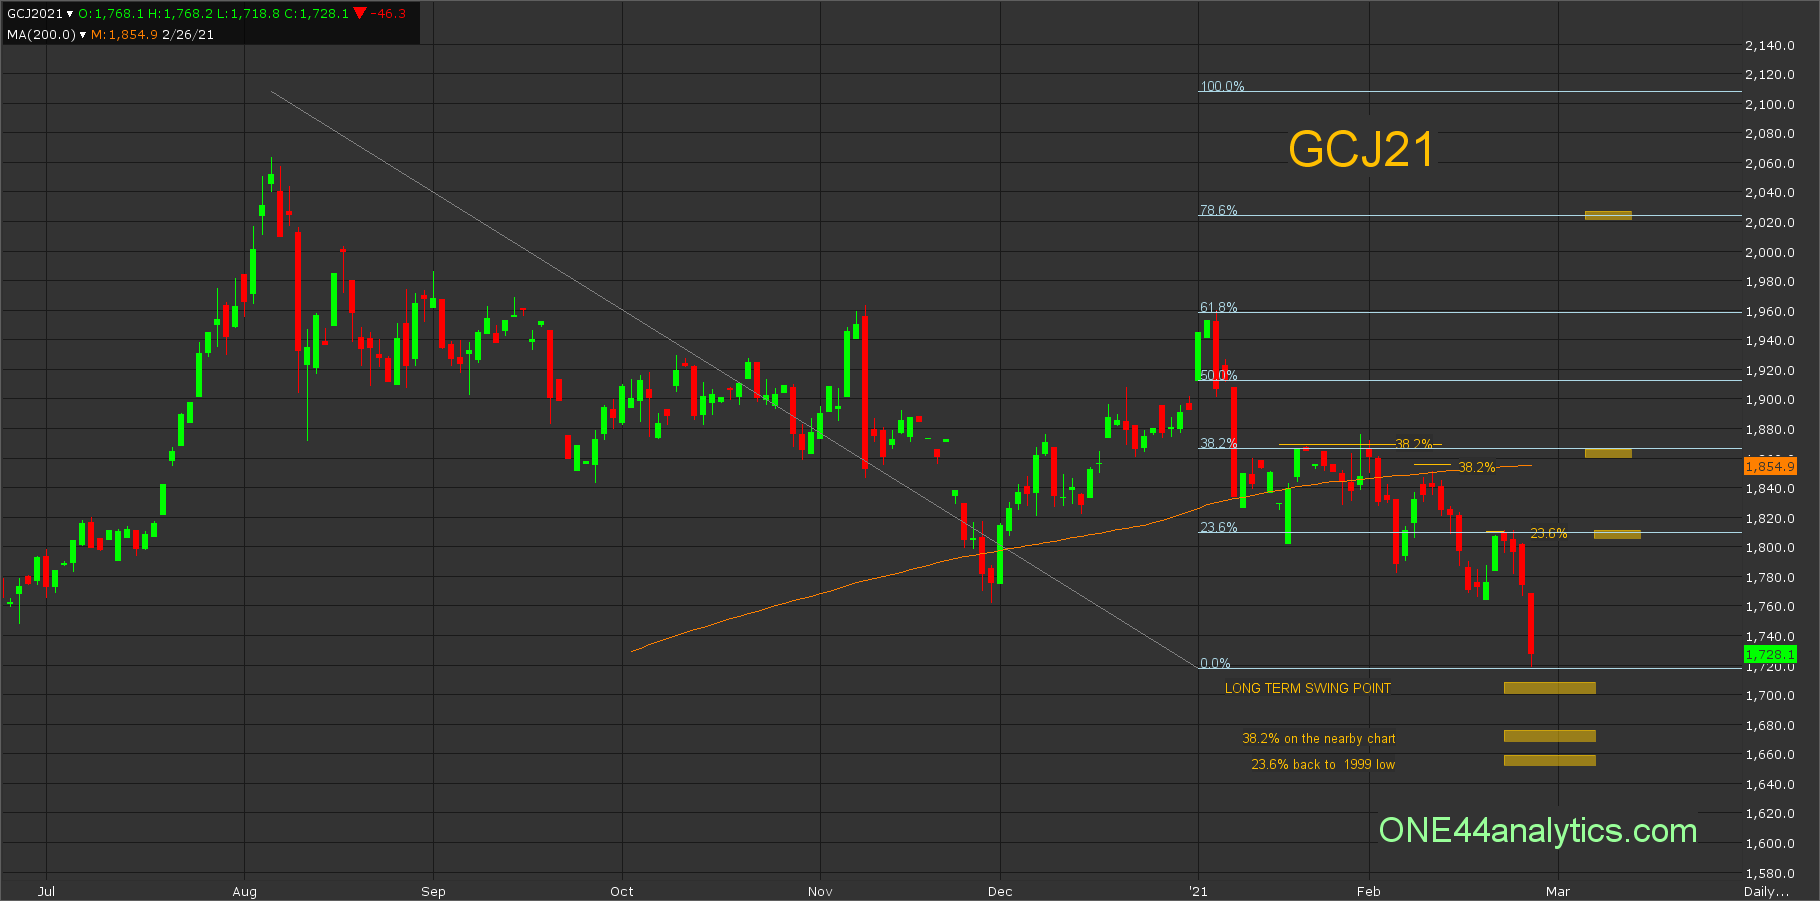
GCJ21
The last three attempts to rally held below key retracements, the first two were stopped by 38.2% back to the 1/6/21 high and the third one could only go back 23.6% of the same high. (marked on chart below) Even as this shows that the market is getting weaker they are coming into some major levels of support. Using just the April contract 38.2% back to the 2018 low is 1700.00, however with the current volatility they could push them down to 38.2% on the nearby chart, this is 1675.00, or to 23.6% back to the 1999 low, this would be 1655.00. Provided they did trade down to the extreme level, it will take a close back above 1700.00 to say there's a chance of that being a bottom and we will watch all the retracements on any rallies to validate that, or not. Failing to hold these extreme levels will do damage to the long term trend and the first major support will be 1560.00. On a rally from Friday's low the first key retracement is 1810.00, this is 23.6% back to the ATH.
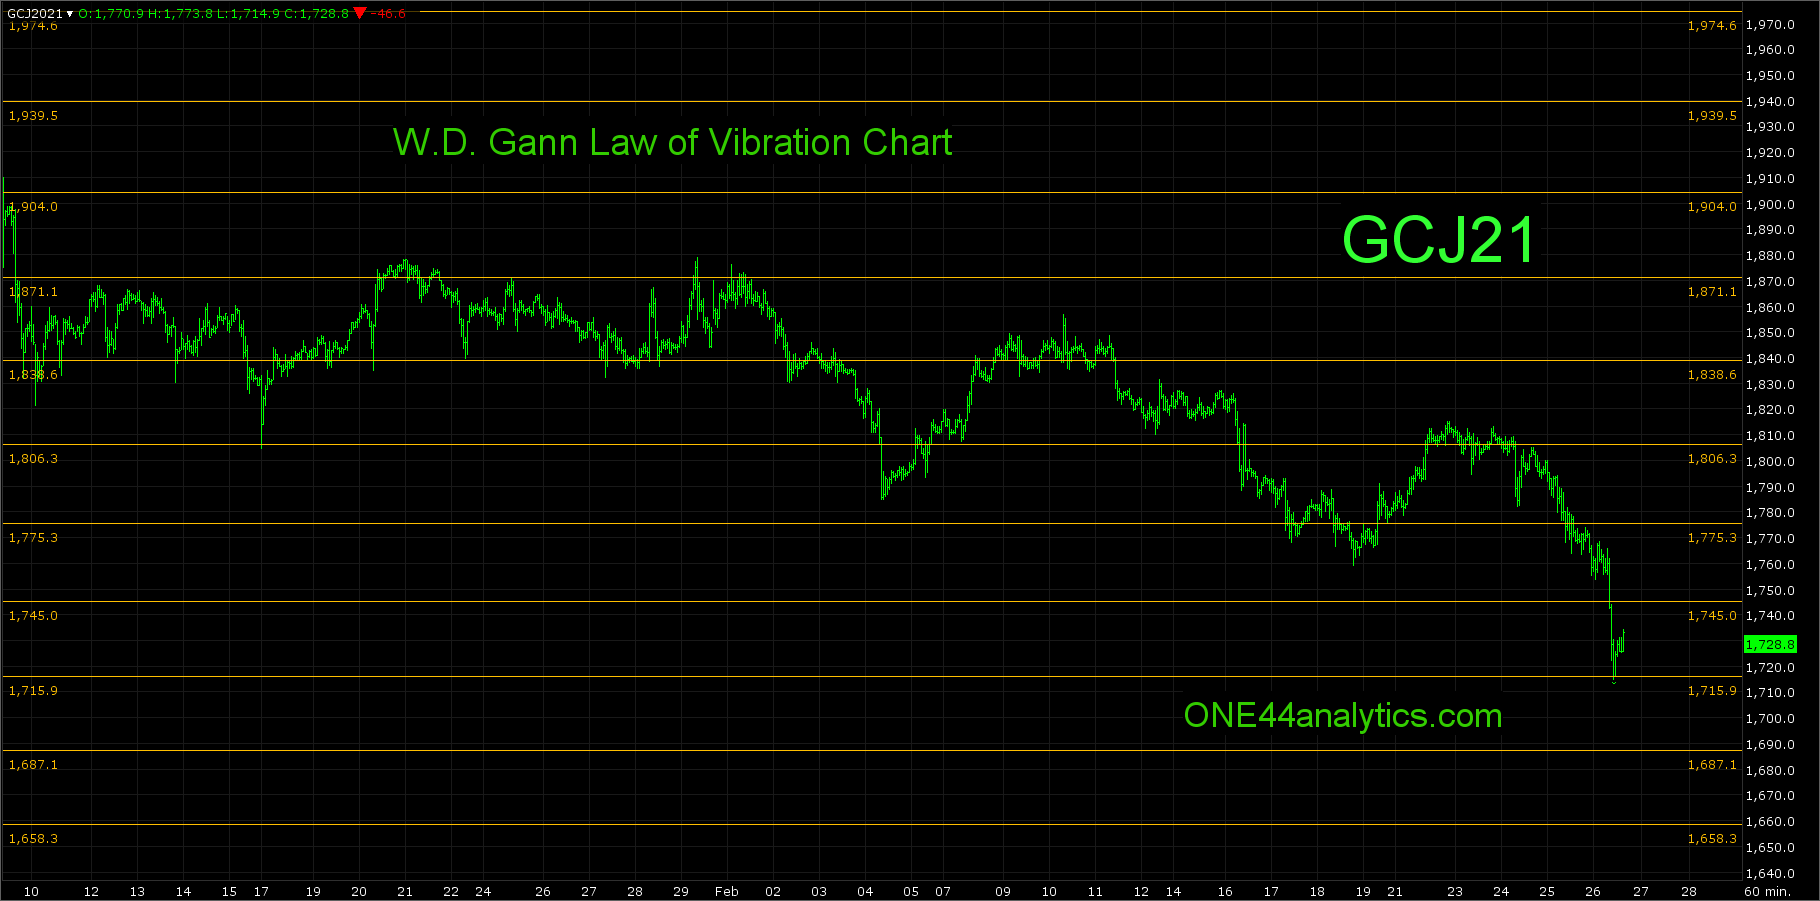
For shorter term support and resistance you can use the "Law of Vibration" chart below.
Our goal is to not only give you actionable information, but to help you understand why we think this is happening based on pure price analysis with Fibonacci retracements and Gann squares.You can get all the rules and guidelines to the Fibonacci retracements on our website
Sign up for our Free newsletter here.