Fibonacci and BBY
ONE44 Analytics where the analysis is concise and to the point
We believe that the Fibonacci retracements are the underlying structure of all markets and in these weekly examples we give educational and actionable information.
As usual we will go back to show you where it has come from and what key levels they held first, then bring you up to date.
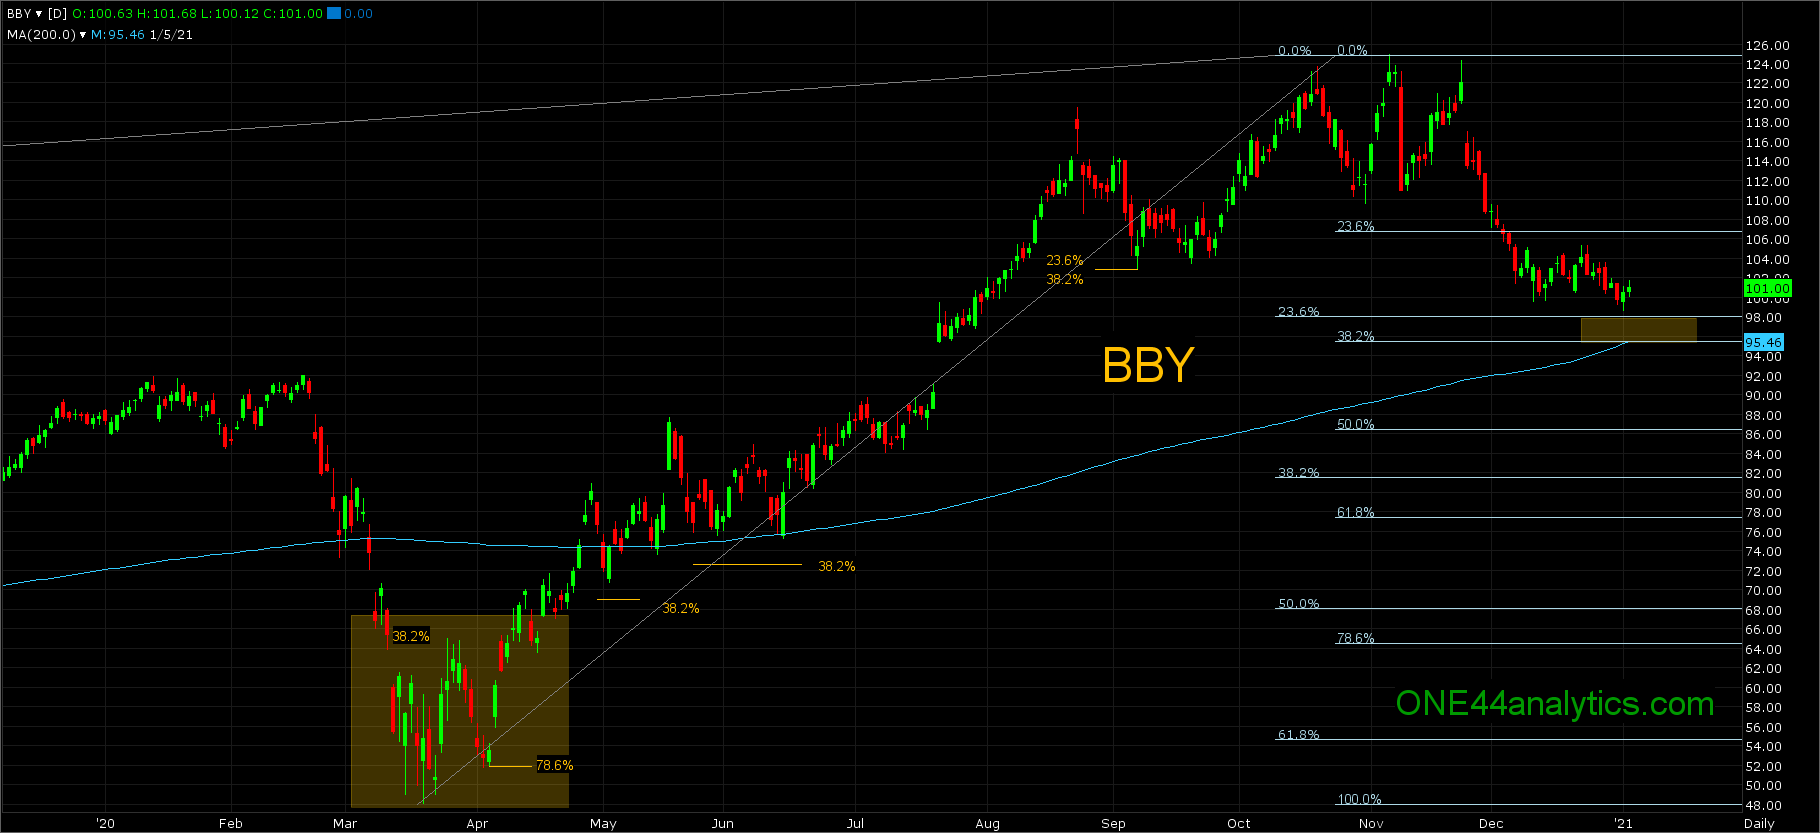
This example in Best Buy/BBY will show you the classic trend change setup that happened in March of 2020 and what to look for now.
The highlighted box on the chart below shows a classic trend change that happened when they hit 38.2% of the move down, but failed to make the new low. As we have said in our ONE44 Rules/guidelines The golden rule deals with the 38.2% level and any time you hold this level it should go for a new high, or low depending on the current direction to keep the trend intact, A failure to make that new high/low is the first sign of a trend change. The first setback when a market is turning will often go 61.8%, or 78.6% back before starting the new move.
As you can see on the chart the first rally from the March 2020 low hit 38.2% on 3/25/20, then the price level it held when it failed to make that new low was exactly 78.6% of the move. Now being that they already held 38.2% on 3/25/20 the target on a rally from here would be 61.8% up at 75.00, per our rules/guidelines. They did this and a lot more and now you should be watching the 38.2% retracement back to the low to see if this new trend is going to continue.
The first setback in the new trend on 5/4/20 could not even get back to 38.2%, the same for the setbacks in the end of May and in June. Each of these setbacks led to another new high as you would expect after staying above 38.2%. The next setback after a run to new ATH's hit 23.6% back to the March low on 9/8/20, this was also 38.2% back to the 6/15/20 low, this led to new ATH's again.
Currently..
All of the whipsaw trading they did up at the ATH held well above 23.6% of the move. They have now taken out 23.6% back to the March 2020 low and we should be looking for 38.2% of that same move, this is 96.00. This is the level that will tell us if the trend remains intact. When you retrace back to the 2012 low, 23.6% of that low is 98.00, so this area is even more important and the 200 day moving average (95.50) is there as well. They can trade below this level, but the close needs to be back above it. One close below is acceptable in certain circumstances.
Holding the 98.00 to 96.00 area should send them up to new ATH's. however as always we will watch all of the retracements on any rally to see just hold strong, or weak the market is. With the low right now, 38.2% back is 108.50, if this is all they can it would be a negative sign. On a failure to hold 96.00 the next target is 61.8% of the March low at 77.50.
Sign up for our Free newsletter HERE
These are our latest videos on how to use the Fibonacci retracements. Even if you do not trade the market covered the rules and guidelines are the same, as we believe the Fibonacci retracements are the underlying structure of all markets.