Gold, SP 500 Futures & High Flying Stocks 6/7/26

NVDA, AMZN, INTC & The 78.6% Retracement Is Below.
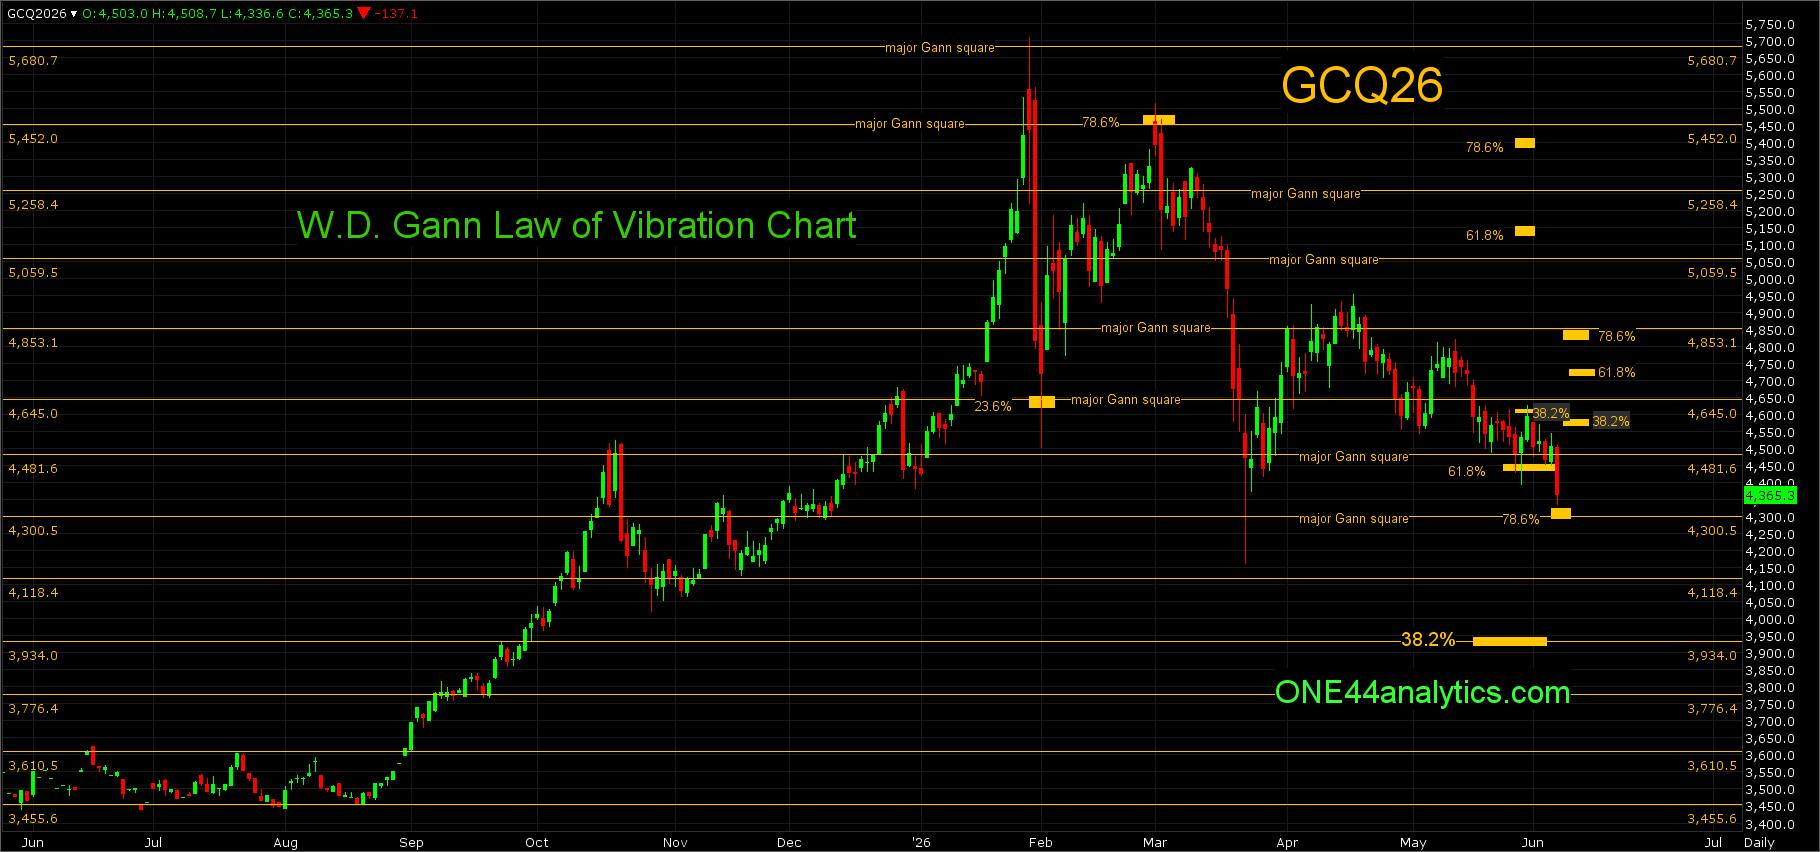
Gold
GCQ26
From last week,
The top month is now August and we will pick up the analysis from the most recent key levels. The low this week traded below the 4481.60 major Gann square and hit 61.8% of the 3/23/26 low and 4/17/26 high at 4454.00. If we follow the ONE44 61.8% rule the longer term target is 61.8% back to where it just came from at 4738.00.The rally so far from 61.8% (4454.00) has reached 38.2% back to the 4/17/26 high at 4607.00 and this will be the key level for the week.
Use 4607.00 as the swing point for the week.
Below it, a failure to get above 4607.00 (38.2%) on the rally from 61.8% at 4454.00 would be a negative sign and a new low can quickly follow. The short term target is 78.6% back to the 3/23/26 low at 4300.50, this is also a major Gann square. The long term target....
The rally from a 61.8% retracement on 5/28/26 failed to get above 38.2% level at 4607.00 and that kept the short term trend negative. This is why we watch all the retracements on every move to see just how strong, or weak the market is regardless of the longer term target. The break below 61.8% at 4454.00 is currently holding above the 78.6% level and major Gann square at 4300.50 and this will be the key level for the week.
Use 4300.50 as the swing point for the week.
Above it, the long term target is 78.6% the other way at 4816.00 per the ONE44 78.6% rule. The short term target is 38.2% at 4560.00, a failure to get above this level keeps the short term trend negative and a new low can quickly follow. The longer term target is 61.8% at 4713.00.
Below it, the short term target is the 4118.40 major Gann square. The long term target is 38.2% on the August continuation chart at 3934.00, this is also a major Gann square.
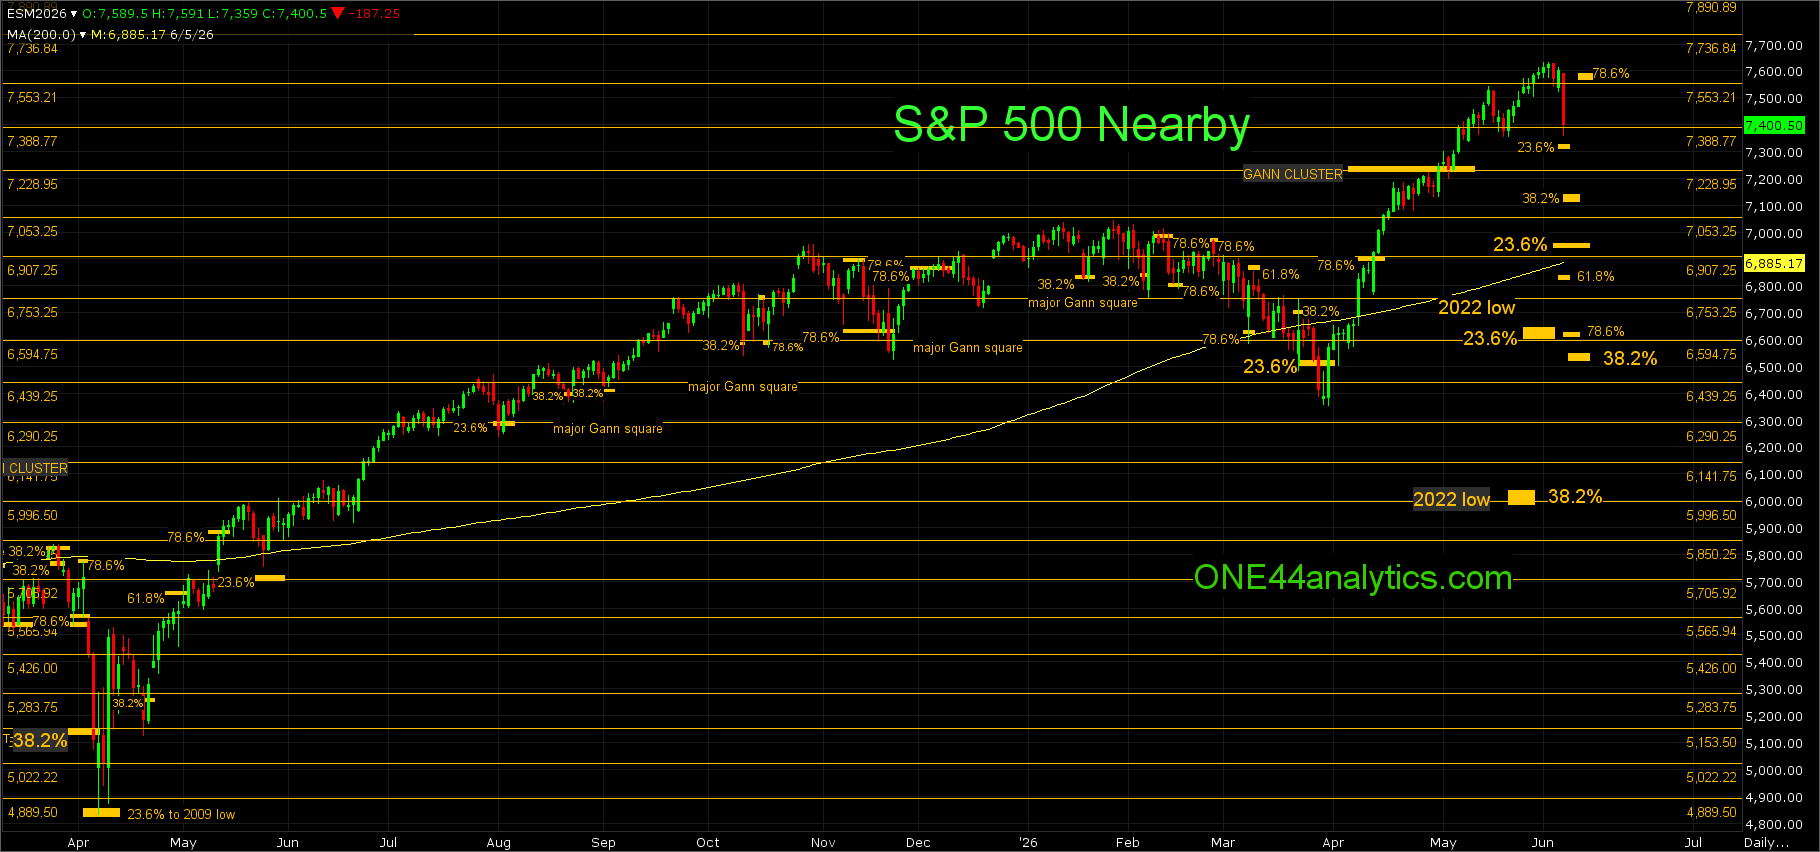
SP 500 Futures
ESM26
All the market could setback was to the previous major Gann square at 7388.70 keeping the trend extremely positive. It now has two closes above the 7553.25 major Gann square and this will again be the key level for the week.
Use 7553.25 as the swing point for the week.
Below it, we will use the 3/31/26 low to retrace back to, when and if it takes out 38.2% of that move we will bring in longer term retracements. The short term target area is 7135.00, this is 38.2% back to the 3/31/26 low at 7081.00. The long term target is 23.6% back to the 2025 low at 6968.00. Any setback that holds 23.6% back to the 3/31/26 low at 7306.00 keeps the trend extremely positive and a new high can quickly follow.
To tell if Friday's action is the start of a longer term top we will watch all the retracement below starting with the ones from the 3/31/26 low. The break on Friday took it to and below the 7388.75 major Gann square and closed back above it and this will be the key level for the week.
Use 7388.75 as the swing point for the week.
Above it, the short term target is 78.6% back to the 6/1/26 high at 7569.00, this level should be adjusted with any new low this week. A failure to turn lower from this area will give us only major Gann squares to look for resistance and then use as the swing point when it is closed above, the next two are 7736.75 and 7890.75. As long as it remains above the 7229.00 major Gann square cluster the long term target is the next major Gann square cluster at 8237.50.
Below it, the short term target is 23.6% back to the 3/31/26 low at 7325.00, holding this level and closing above the 7388.75 major Gann square can it quickly to a new high. The longer term target is 38.2% of the same move at 7150.00 failing to hold this area would turn the short term trend negative. The long term target is 23.6% back to the 2025 low at 6963.00. If the market starts to melt down the first key area is 6645.00 to 6555.00, in this area it is 23.6% back to the 2022 low, 78.6% back to the 3/31/26 low and 38.2% back to the 2025 low.
If you would like free updates on Gold & SP Futures, Go Here.
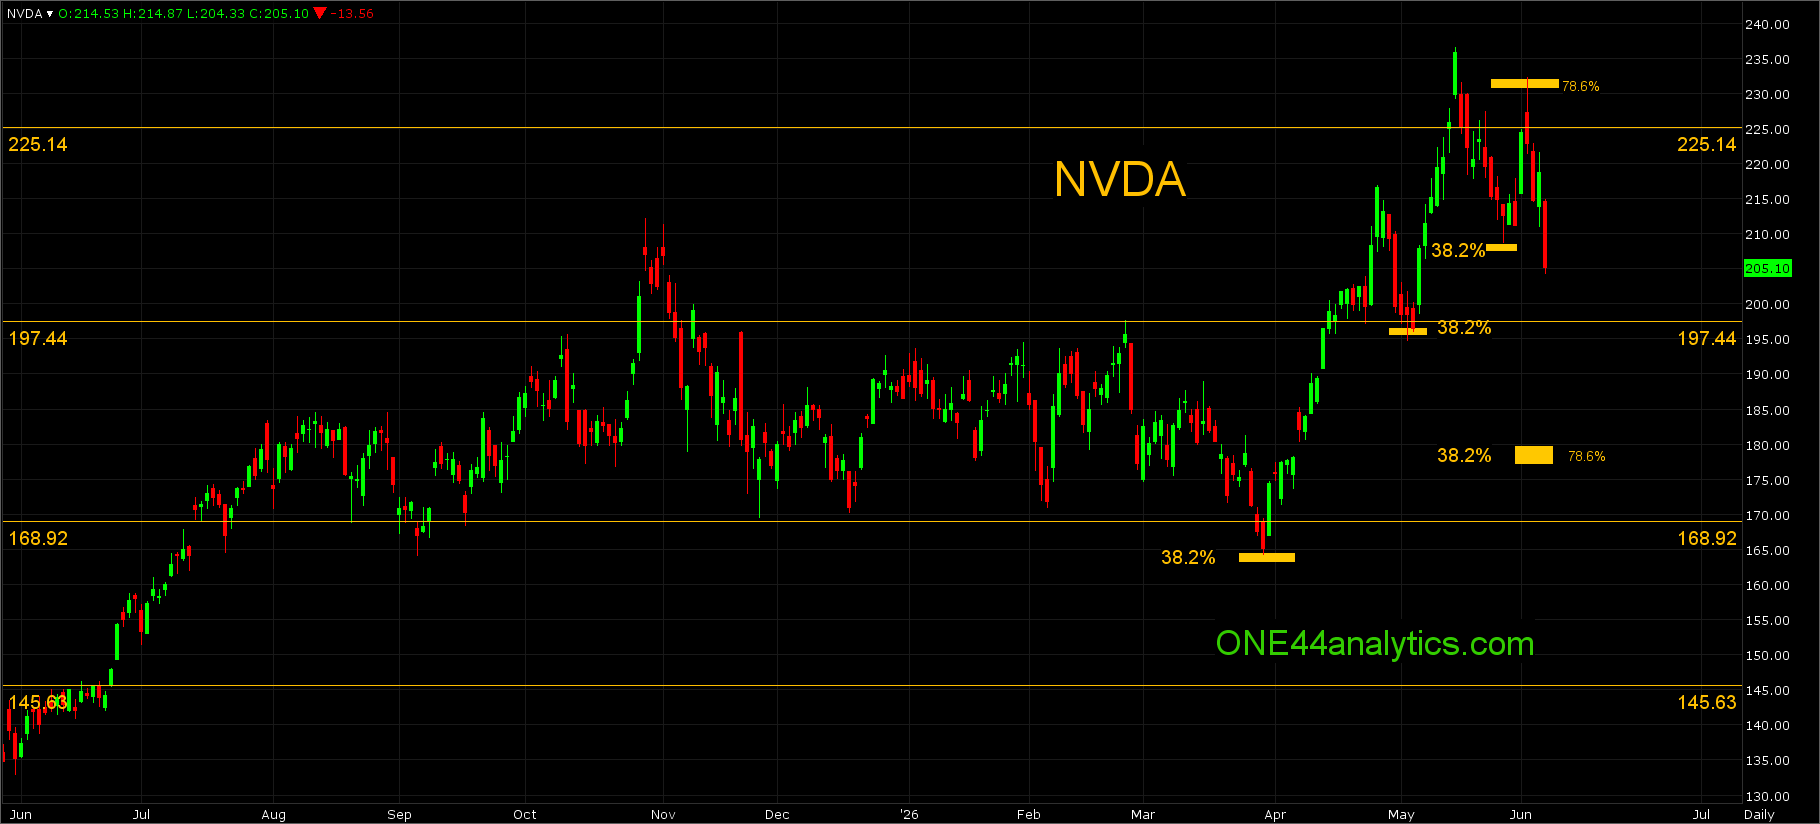
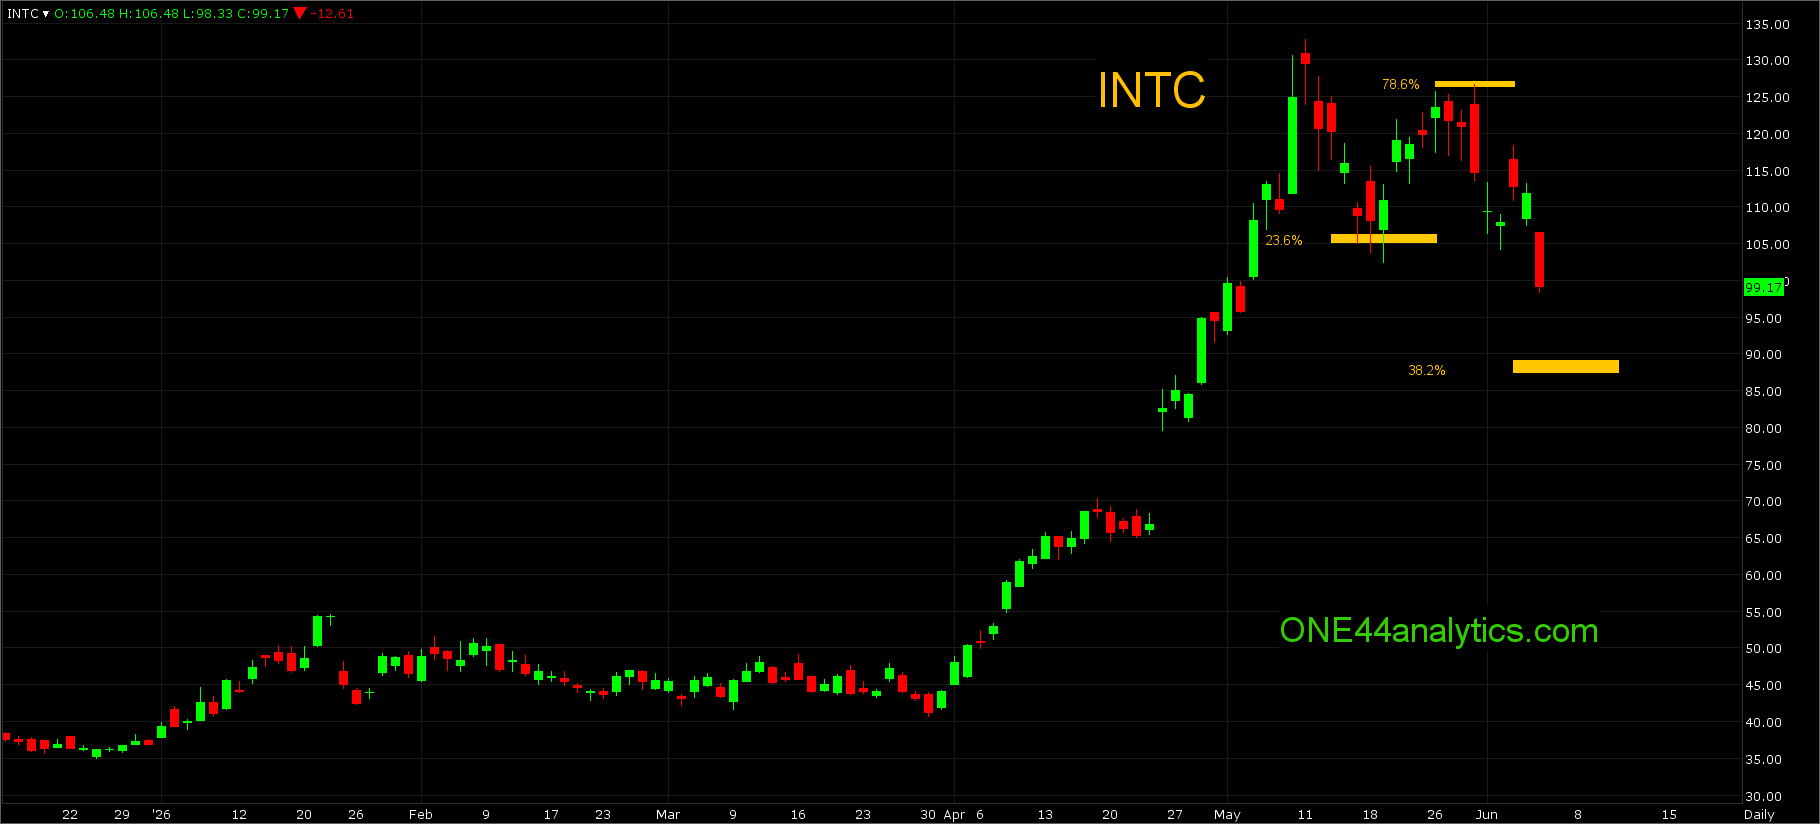
NVDA, AMZN, INTC & The 78.6% Retracement
NVDA
From last week,
The current setback in NVDA hit 38.2% back to the 3/30/26 low at 208.50. Use this as the swing point for the week. Provided it holds, look for a new high. As always we watch all the retracements on all moves to see just how weak, or strong the market is regardless of the longer term target. Having said that, watch 78.6% back to the 5/14/26 high at 231.00, as the ONE44 78.6% rule says, a failure to make a new high in the area of a 78.6% retracement can be the end of the Bull run for the time being.
This week's action is why we will always watch the 78.6% retracement as it is where some of the quickest moves come from.ONE44 78.6% rule,
Any market that hits 78.6% should go 78.6% back the other way. This is also where a lot of Bull markets end and start.
When a market does react to 78.6% it usually creates wide swings that go through all the other retracements, this either happens in very large trading ranges or very small, it is also the level hit most often when the market is reacting from 23.6% and 38.2% and fails to make the new high/low. This is where a lot of Bull runs start and end.
The rally after holding 38.2% on 5/27/26 took it right to the 78.6% retracement at 231.00, it has already come off $25.
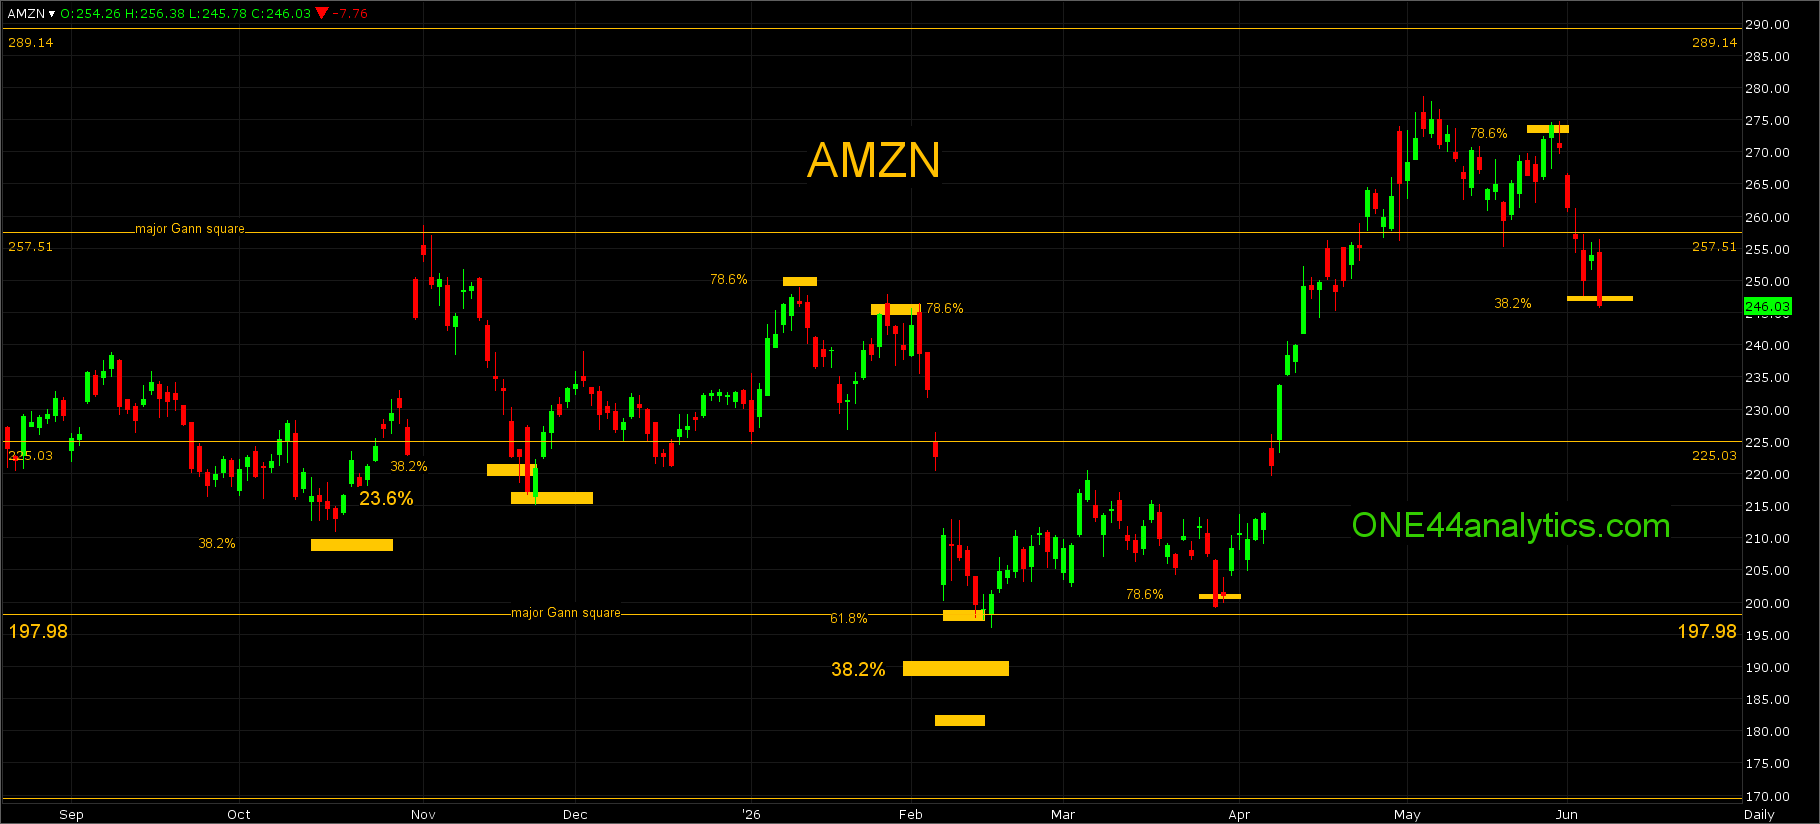
The same reaction happened in AMZN and INTC.
In AMZN the 5/28/26 high hit 78.6% back to the 5/5/26 high at 273.00 and the break from it so far is over $25.
INTC held 23.6% on 5/19/26 and the rally from it hit 78.6% on 5/29/26 at 126.50 and the break from it is over $25 so far.
ONE44 Analytics where the analysis is concise and to the point
Our goal is to not only give you actionable information, but to help you understand why we think this is happening based on pure price analysis with Fibonacci retracements, that we believe are the underlying structure of all markets and Gann squares.
If you like this type of analysis and trade the Grain/Livestock futures you can become a Premium Member.
You can also follow us on YouTube for more examples of how to use the Fibonacci retracements with the ONE44 rules and guidelines.
FULL RISK DISCLOSURE: Futures trading contains substantial risk and is not for every investor. An investor could potentially lose all or more than the initial investment. Commission Rule 4.41(b)(1)(I) hypothetical or simulated performance results have certain inherent limitations. Unlike an actual performance record, simulated results do not represent actual trading. Also, since the trades have not actually been executed, the results may have under- or over-compensated for the impact, if any, of certain market factors, such as lack of liquidity. Simulated trading programs in general are also subject to the fact that they are designed with the benefit of hindsight. No representation is being made that any account will or is likely to achieve profits or losses similar to those shown. Past performance is not necessarily indicative of future results.