Gold & SP 500 Futures, Part 2
Here is what I do know and what I don't know.
Starting with what I don't know,
If you ever read any analysis that is fundamental in nature in a ONE44 Analytics Update stop reading and go somewhere else for that. I have never followed the market fundamentally and never will and here is why. In order to trade any market (futures, or stocks) you would have to have amazing contact sources in every market to get the inside scoop on what is happening, whether it is crop/earnings reports, or who is saying what at the moment on the world stage.
Here is what I do know,
The most important Technical Analysis tool is the Fibonacci retracements with the ONE44 rules and guidelines (in our opinion). In our Weekly Updates for Grains/Livestock and Gold/SP500 Futures our goal is to educate everyone on how to use the Fibonacci retracements so that you will know why we think what we think in our Updates. The ONE44 rules and guidelines are the exact same for every market allowing you to trade anything. It lets you know what retracement needs to hold to keep the current trend intact, which retracement causes an acceleration of the trend, where the market has a greater chance of reversing the current trend and the one that can put the market in a wide trading range.
With the wild moves overnight it never ceases to amaze me how well ALL markets adhere to the Fibonacci retracements. In the latest case we put out an Update for the SP500 Futures and Gold yesterday, in it we mentioned how both markets had turned lower when they failed to make new highs in the area of a 78.6% retracement and what the key levels were below and why.
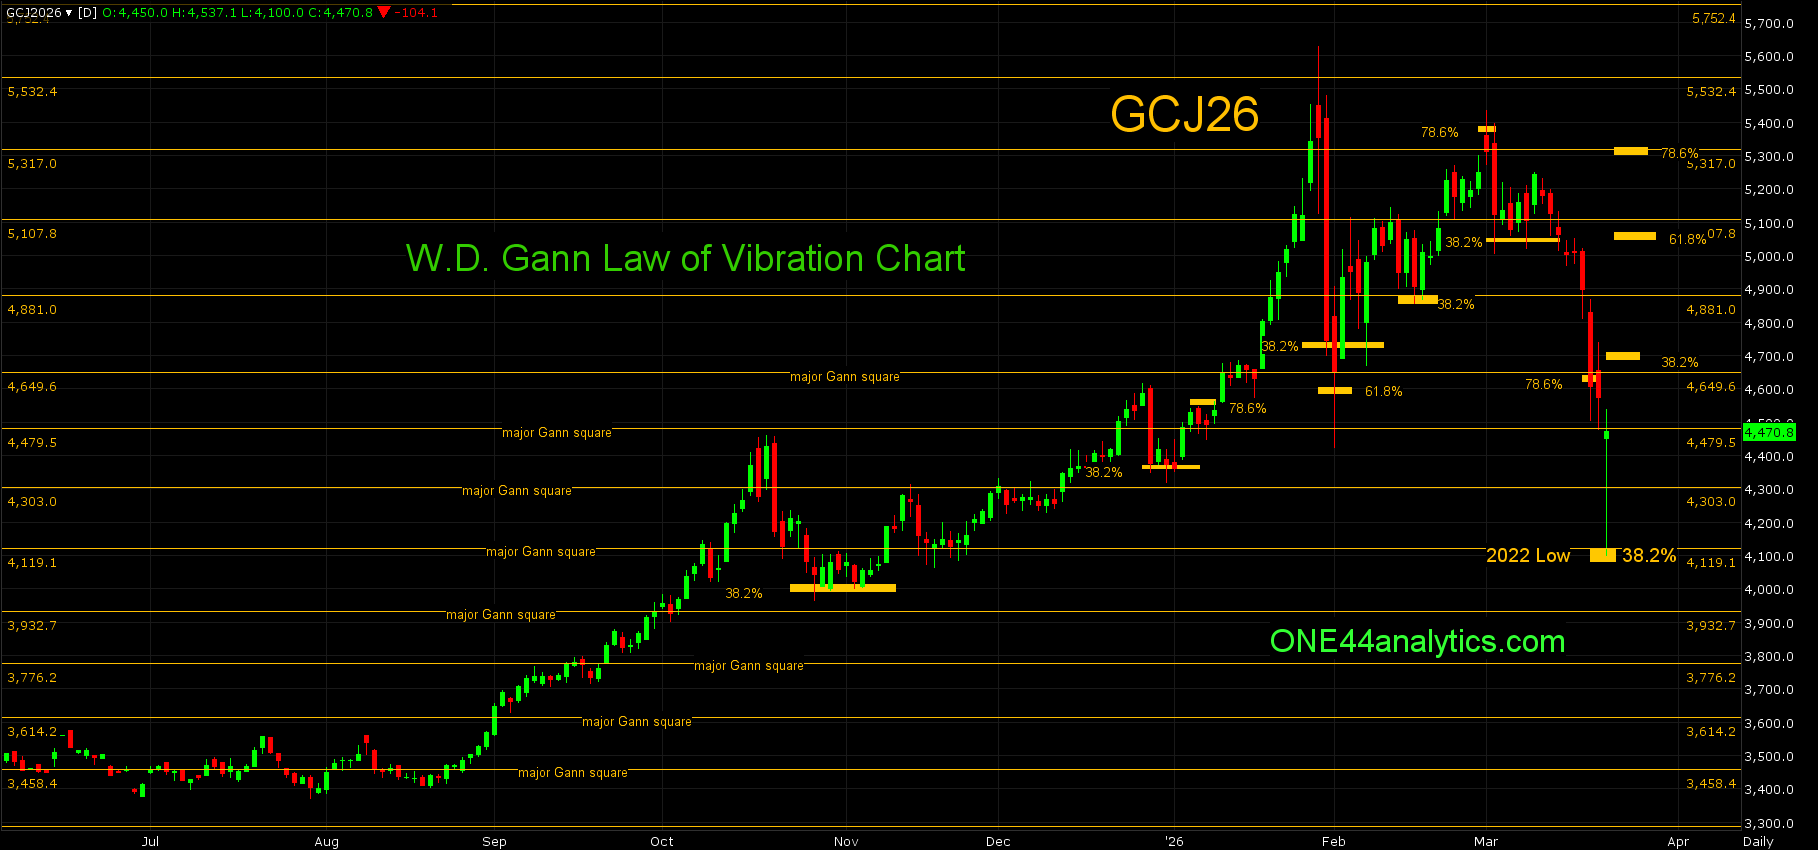
GOLD
In Gold we said,
The huge break this week came from the failure to make a new high in the area of a 78.6% retracement on 3/2/06,
ONE44 Analytics 78.6% Rule,
It accelerated after it took out the 5052.00 (38.2%) swing point. The move down hit the longer term target of 78.6% at 4644.00 and completed the 78.6% (5374.00) to 4644.00 per the ONE44 78.6% rule. It has two closes below it and this will be the swing point for the week.
Any market that hits 78.6% should go 78.6% back the other way. This is also where a lot of Bull markets end and start.
Use 4644.00 as the swing point for the week.
Below it, The short term target is the 4303.00 major Gann square. The long term target is also the long term swing point at 4119.00, this is 38.2% back to the 2022 low and a major Gann square. A failure to hold
It has already rallied over $400 from this level and 38.2% back to the ATH at 4685.00 will be the short term target.
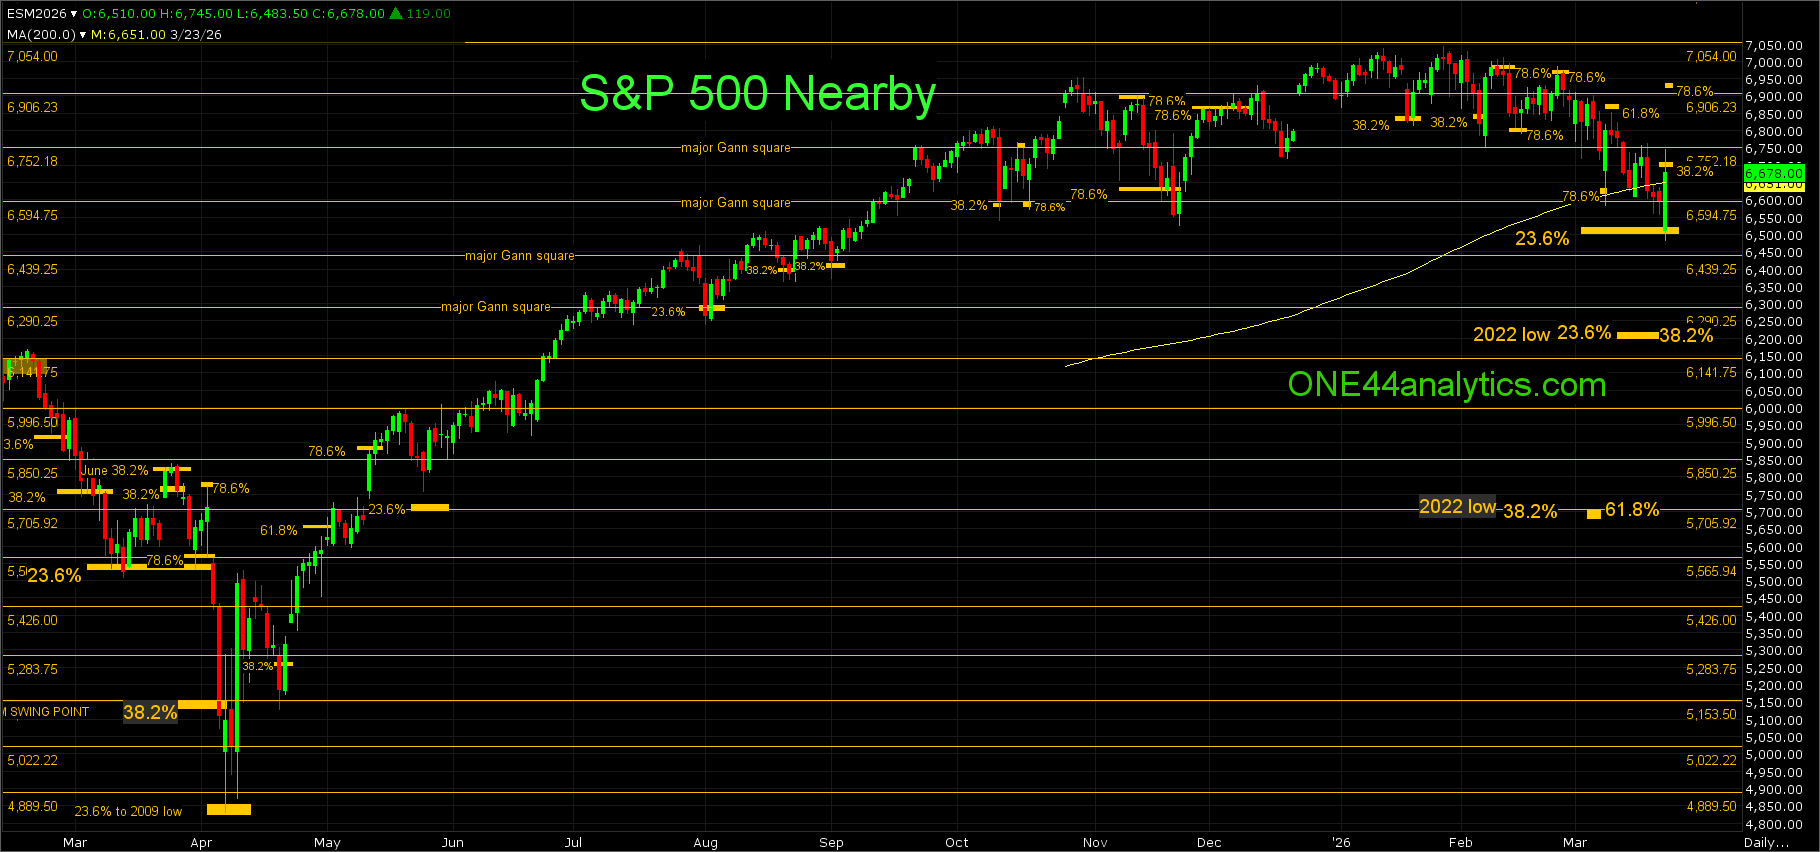
SP 500 Futures
In the SP 500 Futures we said,
The initial move down on 3/9/26 sent the market right into the short term target area of 6636.00 to 6594.00, this is 78.6% back to the 11/21/25 low, the 200 day average (6608.00) and the 6594.00 major Gann square, what followed was a massive 250 point rally in a day and a half. That rally fell short of 61.8% at 6865.00 and then went right back into the short term target area. Friday's low was $3 short of the longer term target at 6520.00 and this will be the key level for the week. The late Friday rally from this area was $65, however with the volatility that the market has been having it could still trade well below and close above it to say the level held. With the current low it will need to get back above the 200 day average at 6647.00 to give the first indication this make is done going down for now. The second would be taking out the 38.2% retracement back to the ATH.
Use 6520.00 as the swing point for the week.
Overnight the market traded below 6520.00 and the rally after getting back above it has already hit the new 38.2% back to the ATH at 6700.00, this will be the key level for the week now.

ONE44 Analytics where the analysis is concise and to the point
Our goal is to not only give you actionable information, but to help you understand why we think this is happening based on pure price analysis with Fibonacci retracements, that we believe are the underlying structure of all markets and Gann squares.
If you like this type of analysis and trade the Grain/Livestock futures you can become a Premium Member.
You can also follow us on YouTube for more examples of how to use the Fibonacci retracements with the ONE44 rules and guidelines.
FULL RISK DISCLOSURE: Futures trading contains substantial risk and is not for every investor. An investor could potentially lose all or more than the initial investment. Commission Rule 4.41(b)(1)(I) hypothetical or simulated performance results have certain inherent limitations. Unlike an actual performance record, simulated results do not represent actual trading. Also, since the trades have not actually been executed, the results may have under- or over-compensated for the impact, if any, of certain market factors, such as lack of liquidity. Simulated trading programs in general are also subject to the fact that they are designed with the benefit of hindsight. No representation is being made that any account will or is likely to achieve profits or losses similar to those shown. Past performance is not necessarily indicative of future results.