Grains Fibonacci targets updated
ONE44 Analytics where the analysis is concise and to the point
Our goal is to not only give you actionable information, but to help you understand why we think this is happening based on pure price analysis with Fibonacci retracements, that we believe are the underlying structure of all markets and Gann squares.
For the ONE44 Fibonacci rules and guidelines to help with this article, go here.
Charts are courtesy of Barchart.com
This is our latest video in an ongoing series of how to use the Fibonacci retracements. Even if you do not trade the market covered, the ONE44 rules and guidelines are the same, as we believe the Fibonacci retracements are the underlying structure of all markets.
https://youtu.be/HEyLVbjvHDg
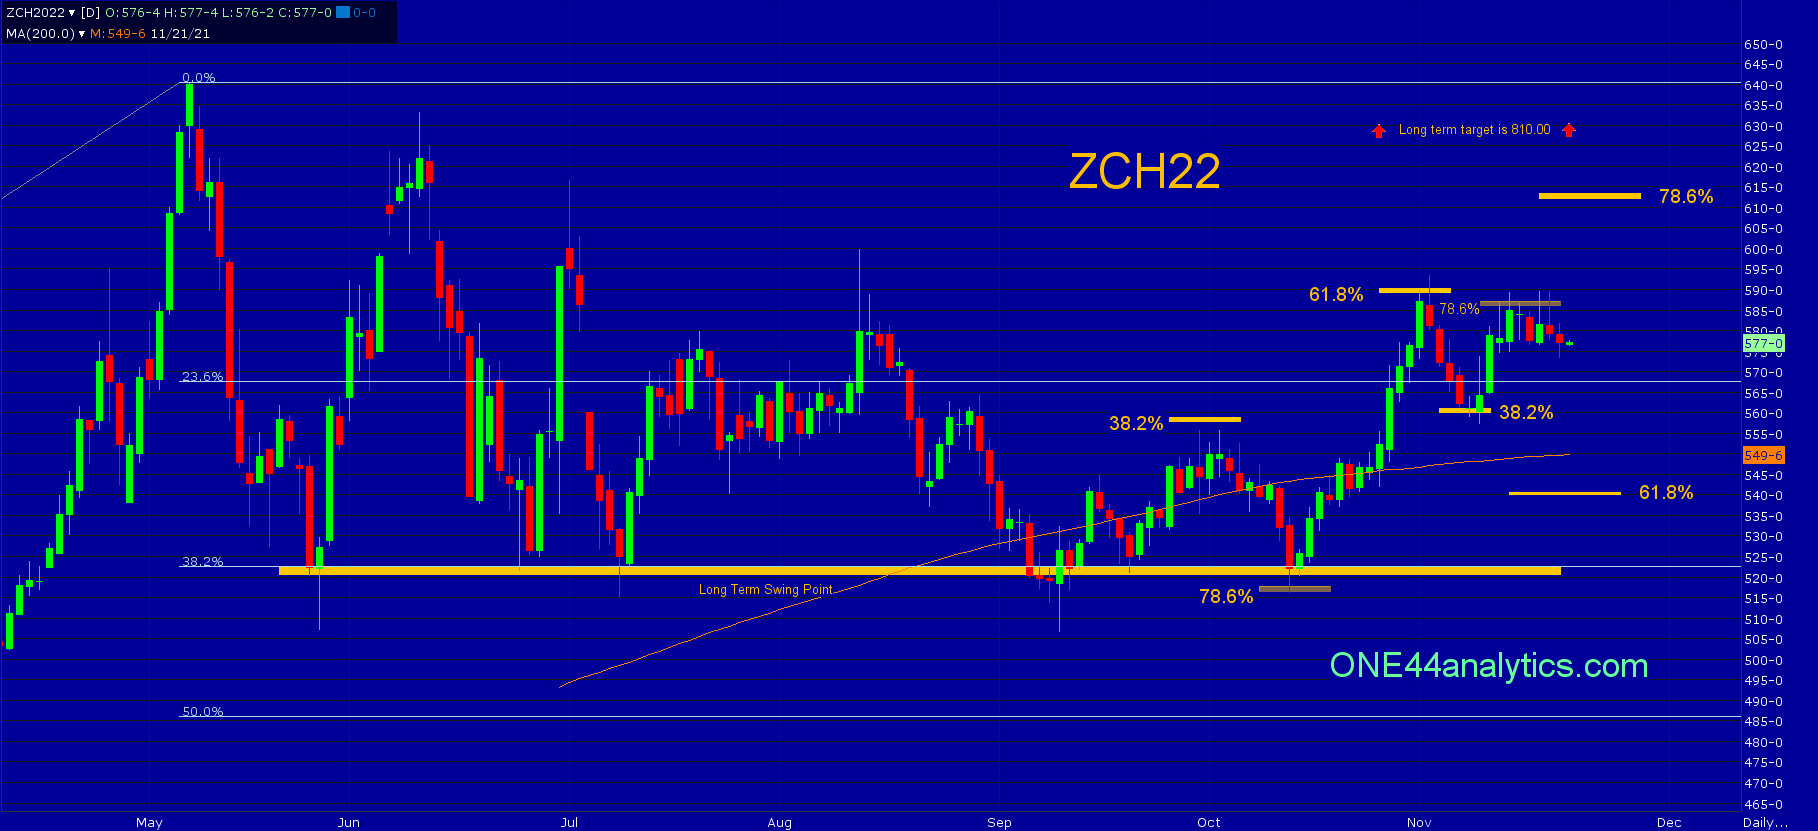
Corn
Not much has changed from the update below on 11/12/21. most of last week's highs traded off of the 78.6% level and as long as it stays below this level look for 541.00. Above it they go for 612.00.
11/12/21
The break from 61.8% at 589.00 on 11/1/21 could only take it down to 38.2% at 560.00 on 11/8/21. The longer term target on a break from 61.8% should be 61.8% the other way and this is 541.00. Until it takes out 589.00 this is still the target. Now we also have the 38.2% level saying it should go for new highs for the move and a failure to make the new high should send it to 61.8% of the same move, this again is 541.00.
Today's high hit 78.6% at 586.00 and following this rule we know to look for 78.6% the other way and that it can be the end of the Bull run. This would also point to 541.00. Provided the rally from 38.2% (560.00) makes a new high, look for 78.6% at 612.00 and then new contract highs.
You can find previous levels explained for Corn, Wheat and Soybeans in this article.
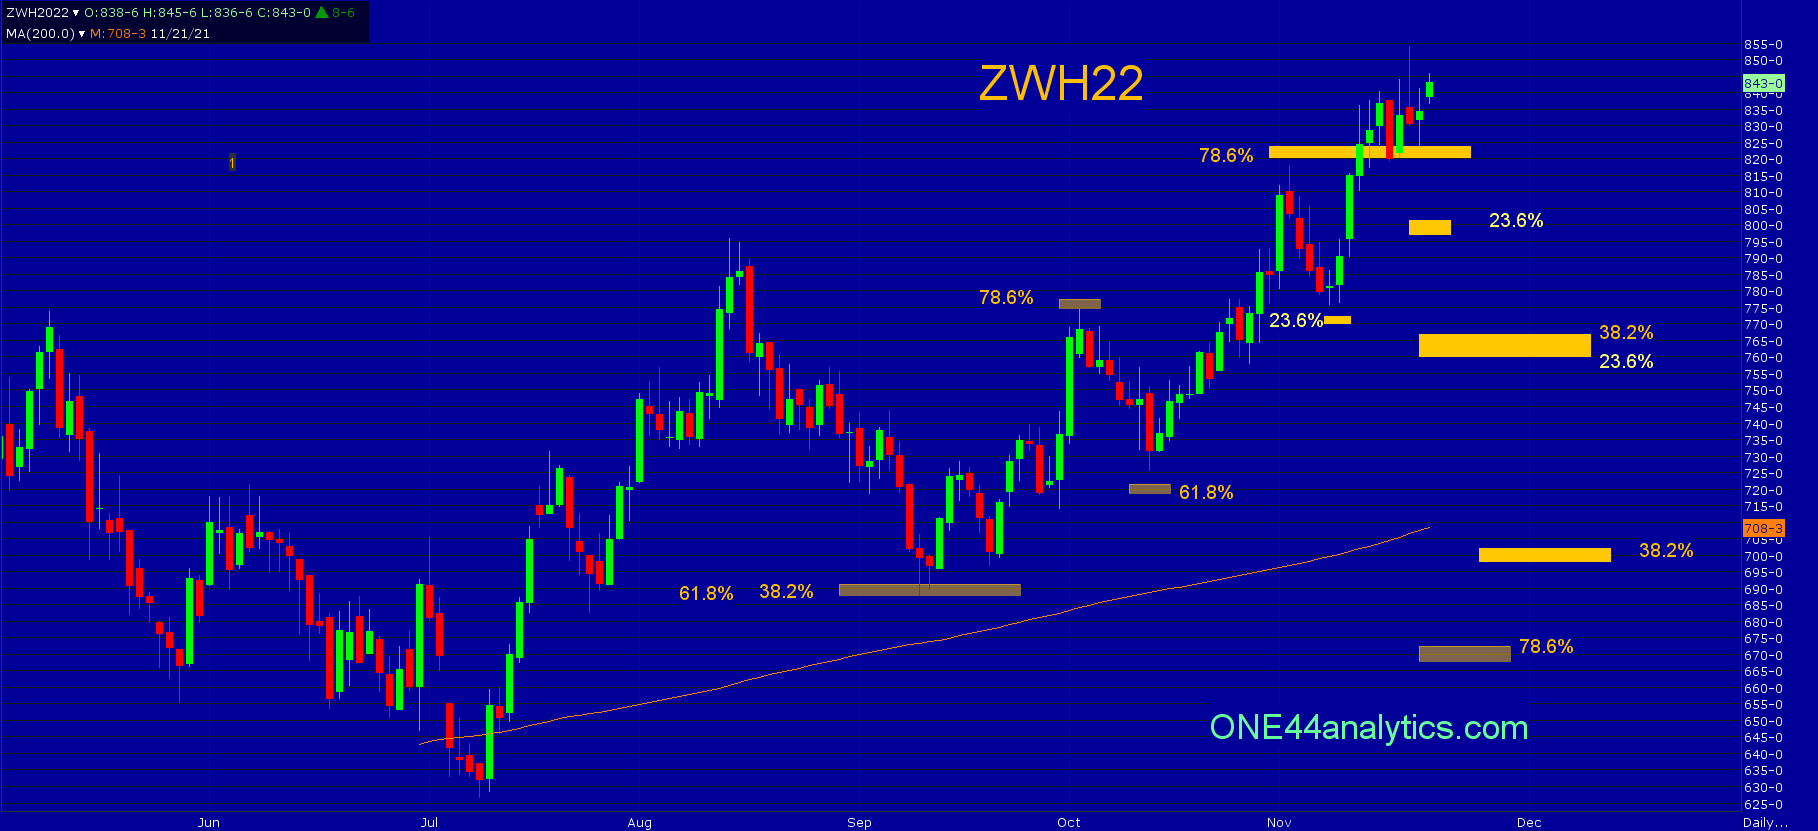
Wheat
As an update to the previous post below,
With a week's worth of closes above 820.00 you can now use it as the short term swing point. Above it, look for the long term target at 960.00. You can use the Gann Law of Vibration charts posted on our site each morning for more resistance levels before 960.00. Back below 820.00 look for 767.00 to 760.00.
11/12/21
Wheat continues to be the strongest of the 3 markets. Last week it fell just short of 78.6% back to the 2012 high. The break from it was only able to get back to 23.6% of the July low, before going for 820.00 again.
Today, it traded above this level and closed close to it. Provided it can get a solid close above it tomorrow look for the long term target of 960.00. Closing right back below 820.00 can send it down to 78.6% the other way and this is 670.00. As always we watch all the retracements on any move and if all it can do is go 38.2% back at 755.00 the short and long term trend remains positive. Any break from 820.00 that can only go 23.6% at 787.00 keeps the trend extremely positive.
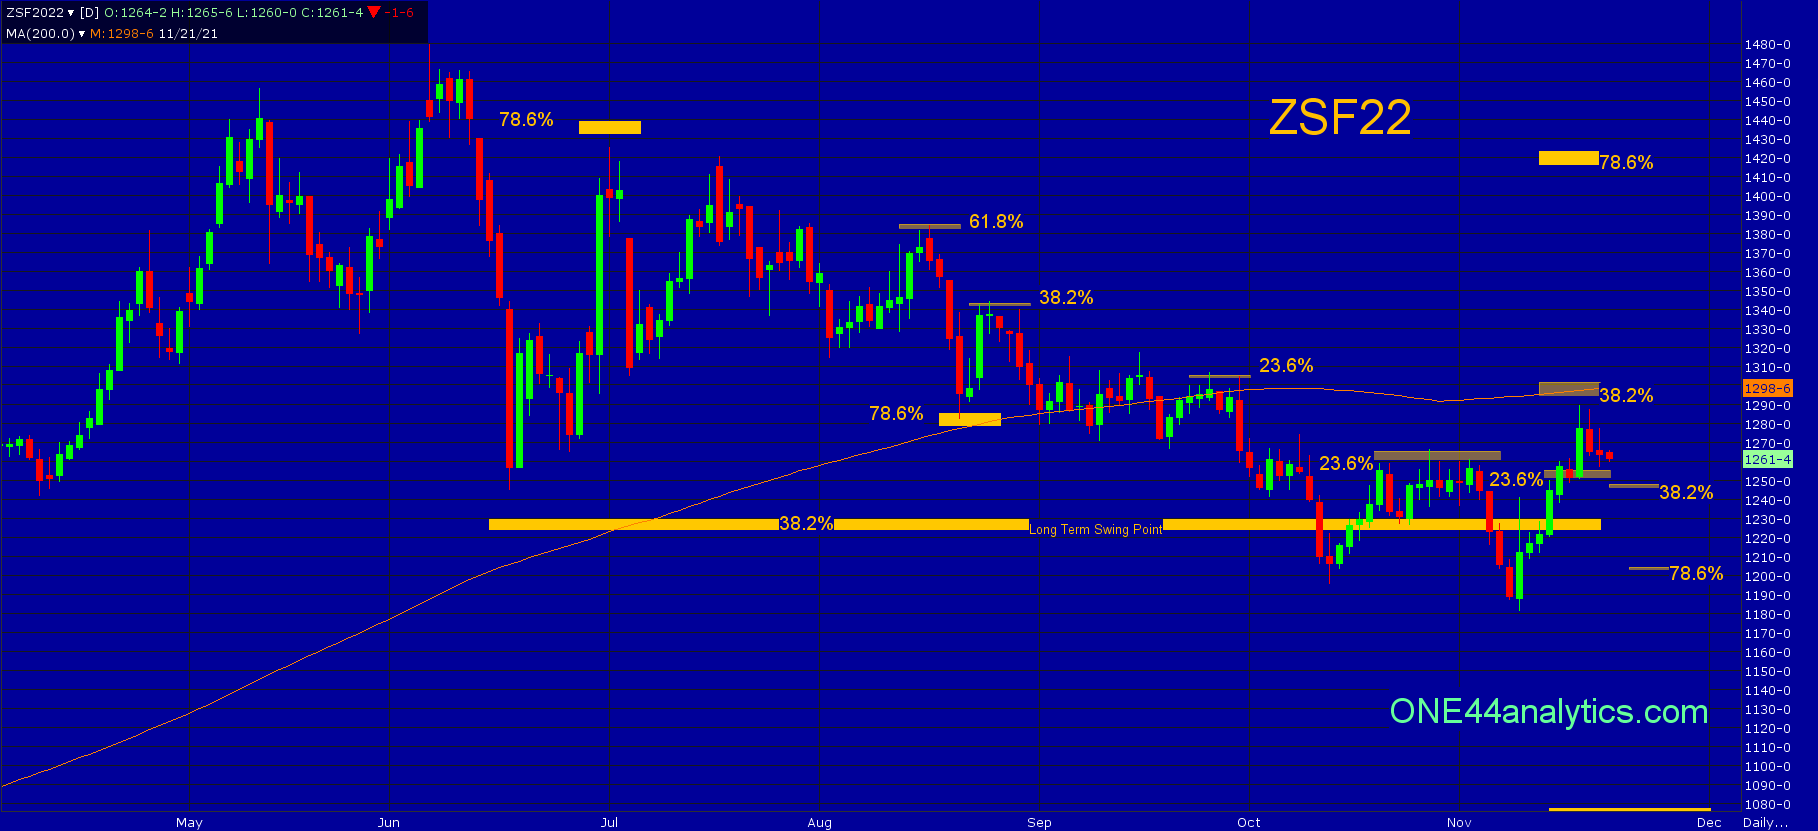
Soybeans
The move back above the long term swing point of 1228.00, took it through 23.6% back to the contract high and just short of 38.2% of the same move, this is 1295.00, the 200 day average is at 1298.00 and this is the area they need to close above to turn the short term trend positive too. If so, look for 78.6% at 1415.00. Any break from the 1295.00 area that can't get below 38.2% of the current rally at 1247.00 would be a very positive sign. Below it, look for 78.6% of the same move at 1205.00.
11/12/21
The last rally above the long term swing point of 1228.00 could only go back to 23.6% of the contract high, keeping the short term trend very negative. The big spike above the long term swing point on Tuesday could not close above it and as long as this continues to be the case we are looking for 61.8% at 1078.00. Getting back above 1228.00 is positive in the long term trend, however it needs to close above 38.2% (1294.00) back to the contract high to turn the short term trend positive. and then we can start to look for the long term levels above.
Sign up for our Free newsletter here.
FULL RISK DISCLOSURE: Futures trading contains substantial risk and is not for every investor. An investor could potentially lose all or more than the initial investment. Commission Rule 4.41(b)(1)(I) hypothetical or simulated performance results have certain inherent limitations. Unlike an actual performance record, simulated results do not represent actual trading. Also, since the trades have not actually been executed, the results may have under- or over-compensated for the impact, if any, of certain market factors, such as lack of liquidity. Simulated trading programs in general are also subject to the fact that they are designed with the benefit of hindsight. No representation is being made that any account will or is likely to achieve profits or losses similar to those shown. Past performance is not necessarily indicative of future results.