How to tell when Ethereum has bottomed

ONE44 Analytics where the analysis is concise and to the point
Our goal is to not only give you actionable information, but to help you understand why we think this is happening based on pure price analysis with Fibonacci retracements, that we believe are the underlying structure of all markets and Gann squares.
Ethereum
The best way that we know of to say when the market has bottomed is using the Fibonacci retracements with the ONE44 rules and guidelines.
Following some basic guidelines we know any market that is going to continue its current direction should hold 38.2% and that a market that is extremely weak, or strong will only get back to 23.6%. The other two retracements are 61.8% and 78.6%. We are going to focus on 23.6% and 38.2% in this post.
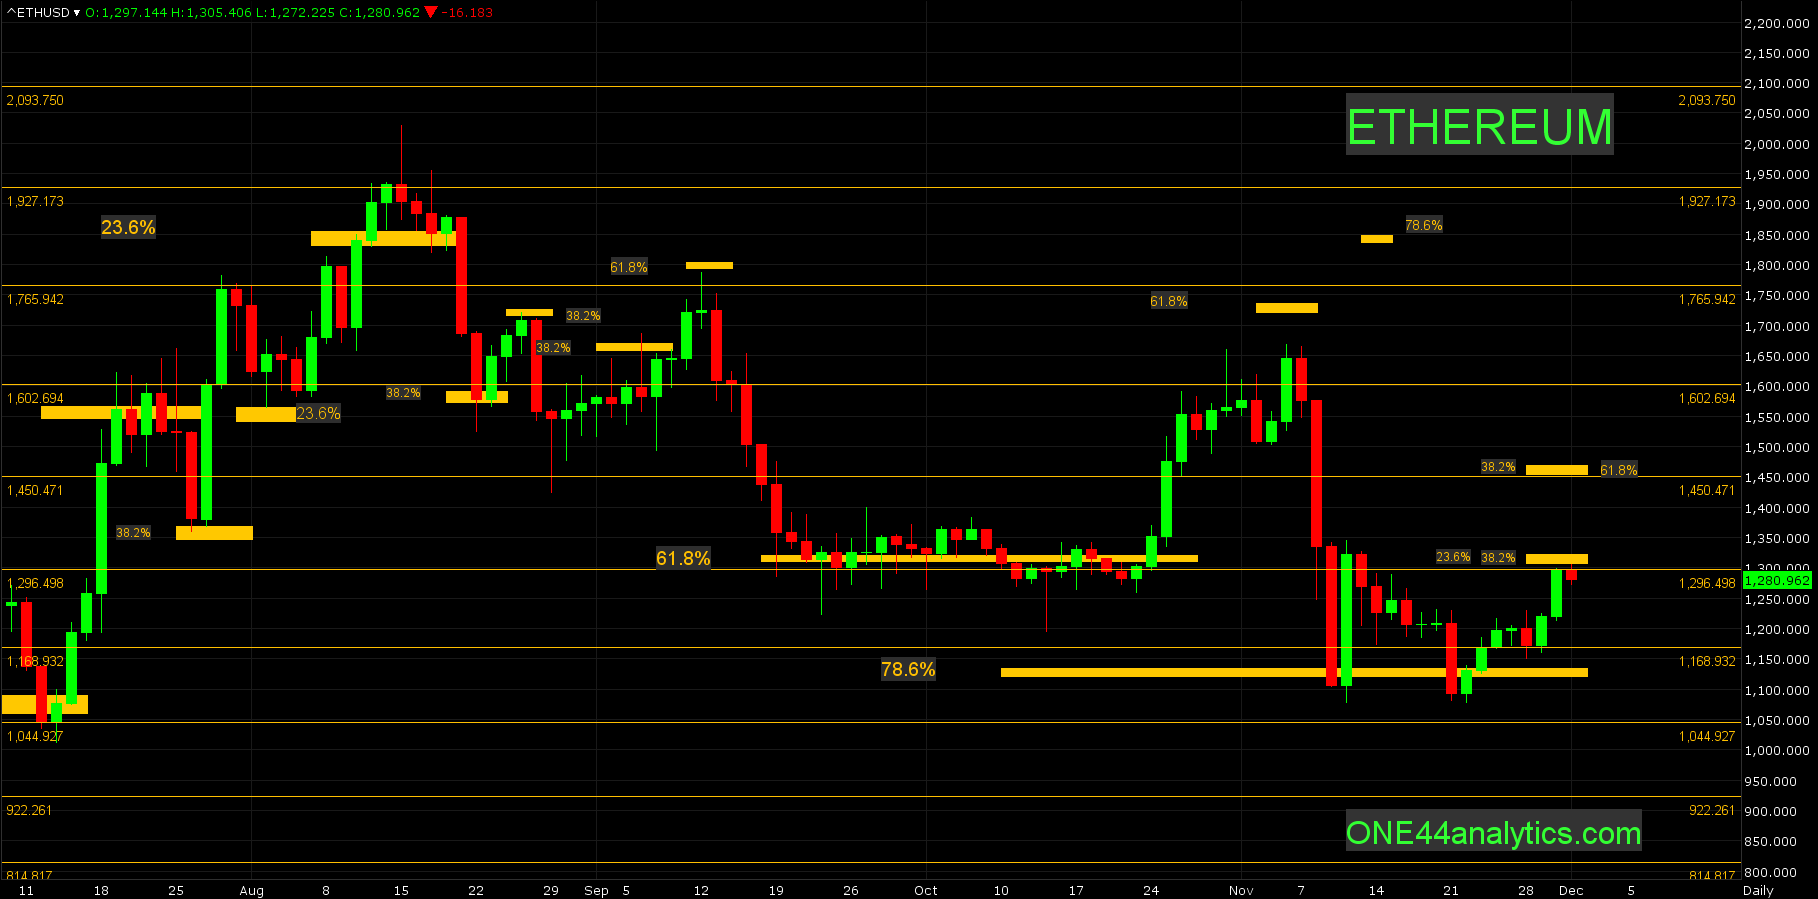
Using the last two highs on 8/15/22 and 11/4/22 we can run the retracements back to these levels from the low on 11/22/22. As you can see on the chart, 23.6% back to the 8/15/22 high is 1307.00 and 38.2% back to the 11/4/22 high is the same. We also use major Gann squares as another method to determine support and resistance and there is one at 1296.00 to give added resistance to this area.
With 1307.00 being both 23.6% and 38.2% of two different highs we will be looking for new lows on a setback from here to keep the current trend negative. A short term target would be the next major Gann square below at 1169.00. A failure to make a new low and or closing above 1307.00 should send it up to 1450.00, this is a major Gann square, 38.2% back to the 8/15/22 high and 61.8% back to the 11/4/22 high.
You will truly know the market has turned up when it starts to hold 38.2% on setbacks, this has yet to happen, but it is the key thing to watch for once it turns up.
You can also follow us on YouTube for more examples of how to use the Fibonacci retracements with the ONE44 rules and guidelines. This is our latest video
Sign up for our Free newsletter here.
FULL RISK DISCLOSURE: Futures trading contains substantial risk and is not for every investor. An investor could potentially lose all or more than the initial investment. Commission Rule 4.41(b)(1)(I) hypothetical or simulated performance results have certain inherent limitations. Unlike an actual performance record, simulated results do not represent actual trading. Also, since the trades have not actually been executed, the results may have under- or over-compensated for the impact, if any, of certain market factors, such as lack of liquidity. Simulated trading programs in general are also subject to the fact that they are designed with the benefit of hindsight. No representation is being made that any account will or is likely to achieve profits or losses similar to those shown. Past performance is not necessarily indicative of future results.