Key Fibonacci levels for Corn and Beans
ONE44 Analytics where the analysis is concise and to the point
Our goal is to not only give you actionable information, but to help you understand why we think this is happening based on pure price analysis with Fibonacci retracements, that we believe are the underlying structure of all markets and Gann squares.
For the ONE44 Fibonacci rules and guidelines to help with this article, go here.
Charts are courtesy of Barchart.com
This is our latest video in an ongoing series of how to use the Fibonacci retracements. Even if you do not trade the market covered, the ONE44 rules and guidelines are the same, as we believe the Fibonacci retracements are the underlying structure of all markets.
https://youtu.be/HEyLVbjvHDg
Corn
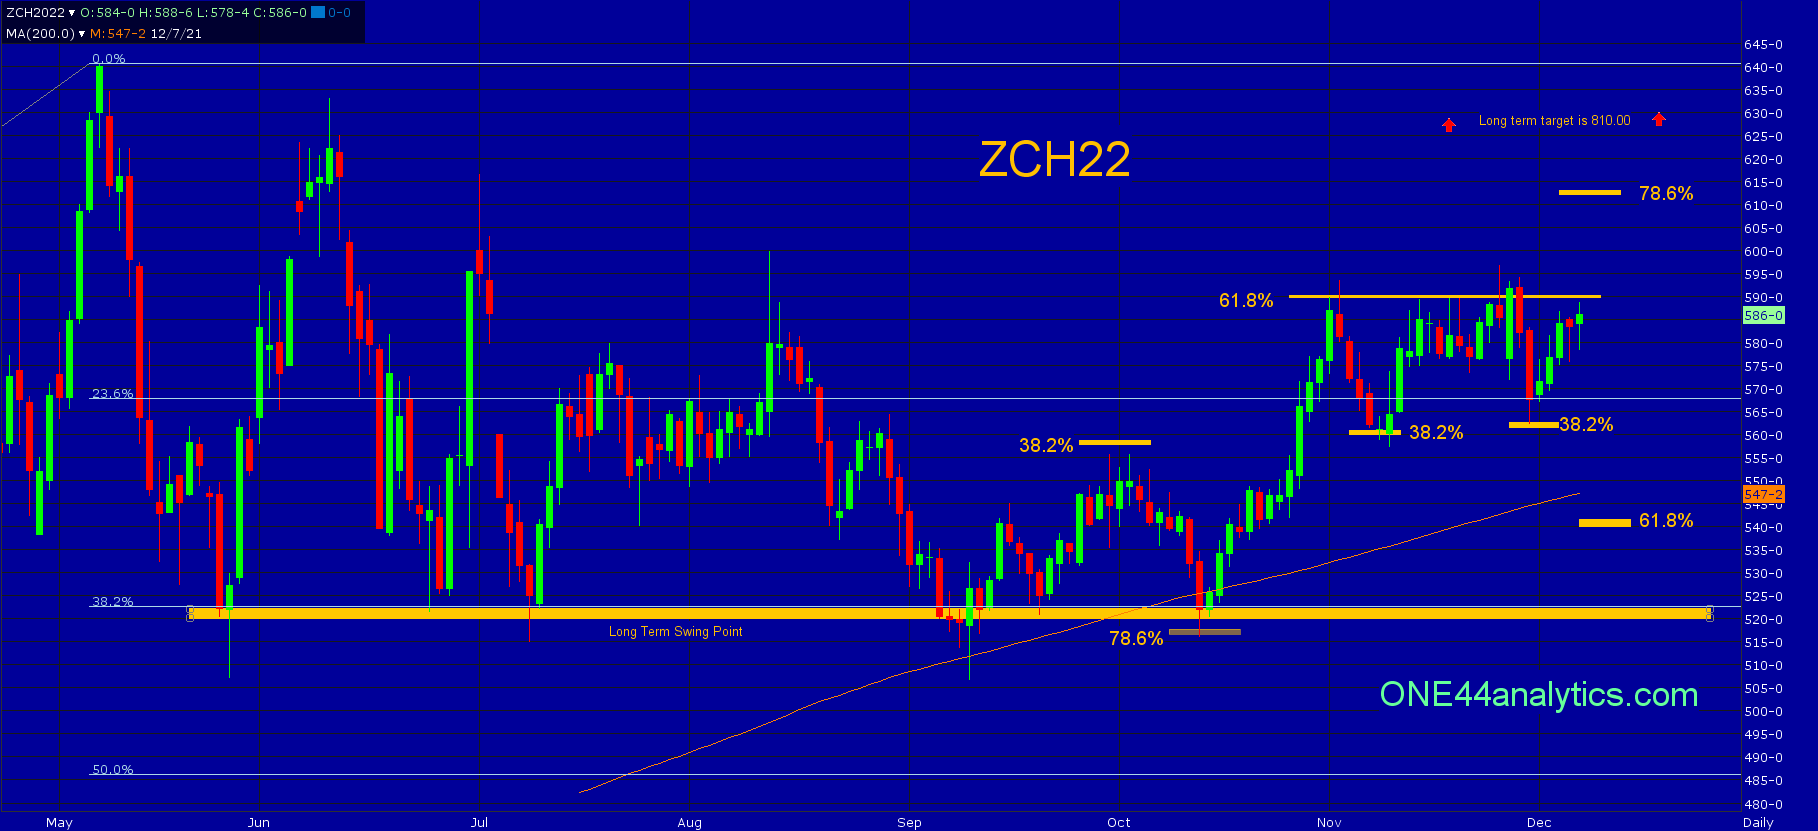
In our last update on 11/29/21 we posted this,
"Corn is well above the long term swing point of 522.00, this is 38.2% of the contract high and low. The rally from this area has taken it up to 61.8% of the contract high, this is 590.00. The first time it setback from there it went right to 38.2% of the move up at 561.00, keeping the short term trend positive as well. They have now hit 591.00 again and we know following the ONE44 61.8% rule that, the target on a break from 61.8% is 61.8% the other way and this is 542.00. You will still have to watch 38.2% (563.00) on any break and if they hold it again, look for new highs and then 78.6% at 613.00."
Today,
The second break from 61.8% (590.00) did hold 38.2% again, this time at 563.00. The rally from there is now approaching 61.8% for the third time. We know from following the ONE44 38.2% rule that we should see new highs for the move to keep the trend positive. Provided they can get through 590.00 this time, look for 78.6% of that same move up at 613.00. We also know when following the 38.2% rule that a failure to make a new high should send it down to 61.8% of the same move and this is 542.00, so both the 38.2% and 61.8% rules point to 542.00 on a break from 590.00. The long term trend remains positive as long as it remains above 38.2% of the contract high and low at 522.00. The long term target is still up at 810.00.
Soybeans
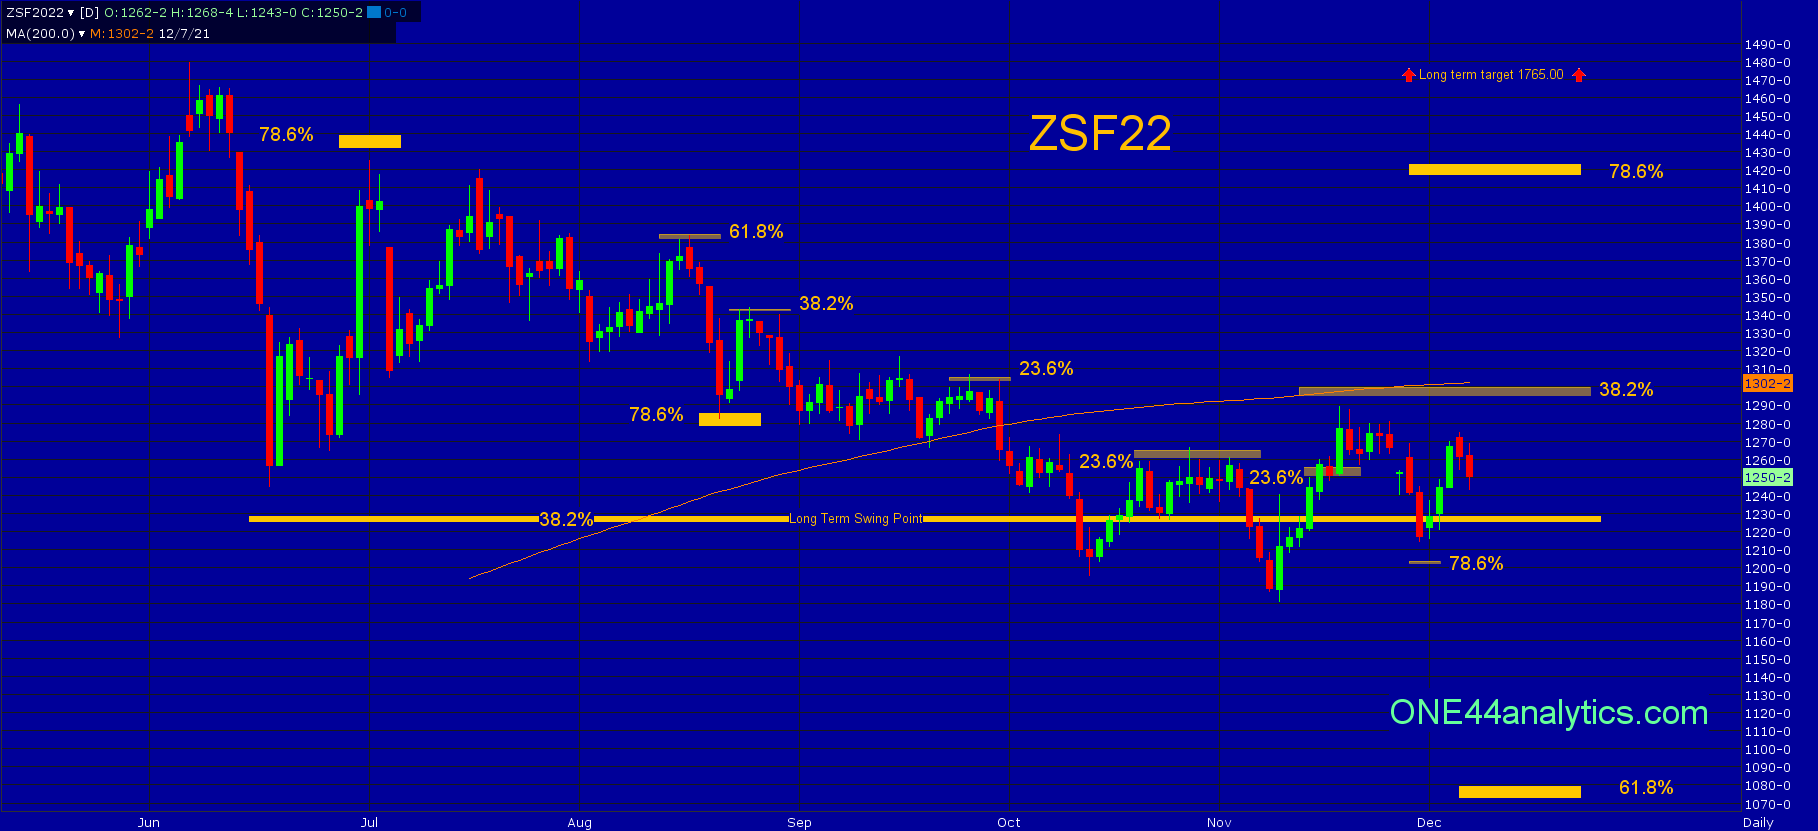
In the 11/29/21 update we posted this,
"They are above the long term swing point of 1228.00, this is 38.2% of the contract high and low and as long as it remains above there, new highs are possible. In the short term however, it is still negative until it can get above 38.2% of the break from the contract high, this is 1295.00. It has been as high as 1289.25 on the current rally and the setback from there has held 38.2% (1247.00) of the move up from 1181.25. Provided they continue to hold this level, look for 1295.00 and with a solid close above that, look for 61.8% at 1864.00. Below 1247.00 look for 78.6% of the recent rally at 1204.00, below here, look for 61.8% of the contract high and low at 1078.00."
Today
For two months now it has traded above and below the long term swing point of 1228.00 without following through on a move higher or lower. This last time down at 1228.00 they had one close below it before rallying again, however they have been unable to get above the short term swing point of 1295.00. This is 38.2% back to the contract high. Once they can clear this level look for 61.8% at 1364.00 (not 1864.00 mentioned by mistake above). Below the long term swing point the target is 61.8% at 1078.00 and provided they can stay above it, this market has the makings to go to 1765.00 when the next bull run gets underway. Once it can get above 1295.00 and the short term trend has turned positive you can start to watch the 38.2% level on setbacks to see if that next run is starting.
Sign up for our Free newsletter here.
FULL RISK DISCLOSURE: Futures trading contains substantial risk and is not for every investor. An investor could potentially lose all or more than the initial investment. Commission Rule 4.41(b)(1)(I) hypothetical or simulated performance results have certain inherent limitations. Unlike an actual performance record, simulated results do not represent actual trading. Also, since the trades have not actually been executed, the results may have under- or over-compensated for the impact, if any, of certain market factors, such as lack of liquidity. Simulated trading programs in general are also subject to the fact that they are designed with the benefit of hindsight. No representation is being made that any account will or is likely to achieve profits or losses similar to those shown. Past performance is not necessarily indicative of future results.